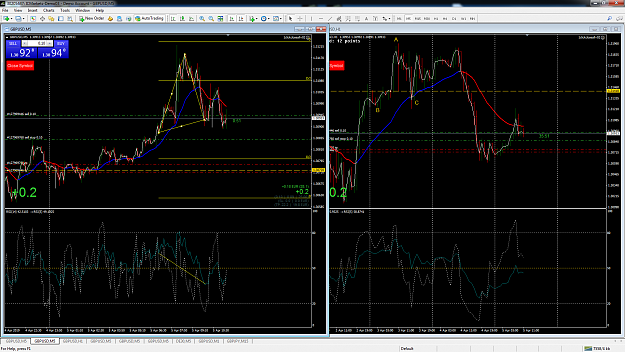
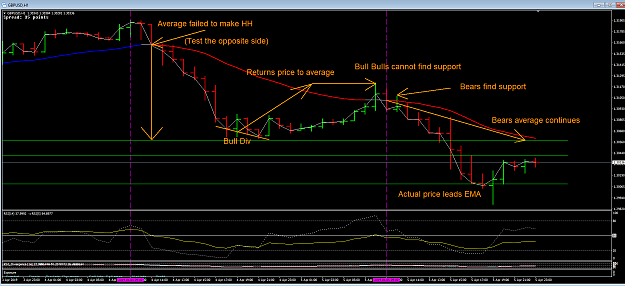
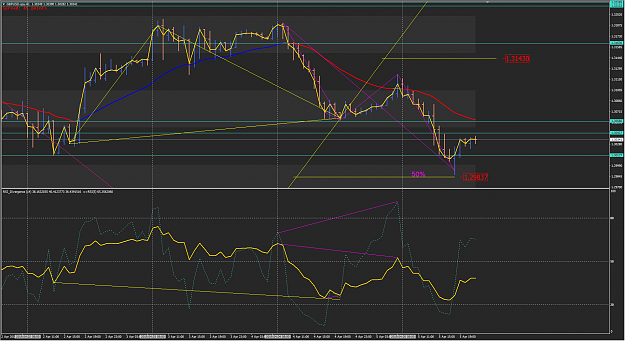
Putting the ABCD's aside, this one hour chart is an absolute classic textbook example of price movement. 1) Finds bear div 2) Stops and turns average causing failed HH swing 3) Fails on one side so test the opposite. 4) Price test swing low average. 5) Bears find support. 6) The bulls have a div but can't break the bull support. 7) So now we should see a price LL What did I do about it? Watched the Crows get hammered again. Note how I was the wrong way in the loading knot but still managed to scalp a few {image}
Ignored
Hi Alan, i was confuse to see bear divergence yesterday. Because i use tail candle, not use body candle to see divergence. Is it better use body or tail candle to look for divergence? Thank you.
{quote} Hi Alan, i was confuse to see bear divergence yesterday. Because i use tail candle, not use body candle to see divergence. Is it better use body or tail candle to look for divergence? Thank you.
Ignored
I would say to you think about what you are saying.
Does the RSI or any other indicator close at the top of the bar (Your tall Candle) or do they close at the same time the bar closes.
Obviously the latter is the case so it is the body that is important when making the comparisons.
Now having said that we can look for hidden divergence where the bar does make the HH in real time but the RSI does not. Again in real time this causes the bar to snap back so the divergence is no longer seen... It is hidden.
{quote} I would say to you think about what you are saying. Does the RSI or any other indicator close at the top of the bar (Your tall Candle) or do they close at the same time the bar closes. Obviously the latter is the case so it is the body that is important when making the comparisons. Now having said that we can look for hidden divergence where the bar does make the HH in real time but the RSI does not. Again in real time this causes the bar to snap back so the divergence is no longer seen... It is hidden.
Good day all.
Hard to develop a plan.
H4 divergence brought price back to the EMA. Question is if the EMA is going to print an HL.
H1 divergence brought price above the EMA. Will it run into Bull support while printing a new EMA HL?
Good day all. Hard to develop a plan. H4 divergence brought price back to the EMA. Question is if the EMA is going to print an HL. H1 divergence brought price above the EMA. Will it run into Bull support while printing a new EMA HL?
Ignored
Personally am bearish until bulls look like finding support on HTF's. Initial areas of interest for 5 min entries are AB=CD ZOO point around 3125 and 4H swing MA high at 3129.
{quote} Personally am bearish until bulls look like finding support on HTF's. Initial areas of interest for 5 min entries are AB=CD ZOO point around 3125 and 4H swing MA high at 3129.
Ignored
your ZOO is also 50% retracement of yesterday's range
Missed the morning short divergence, but market (even in NFP day) gave 2nd chance. Took the short after the 2nd rejection of the 5m EMA (also was rejection of 1H EMA)
I don't know whether 5m ABCD was correct. If it was my extra clue was market didn't managed to climb even to D/2 level.
PS ignore the ABC in 1H chart, left it there for future reference.
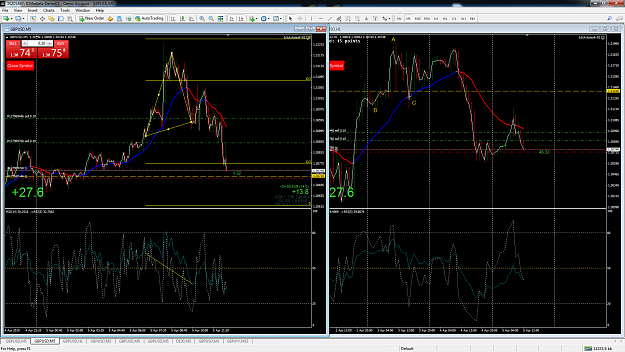
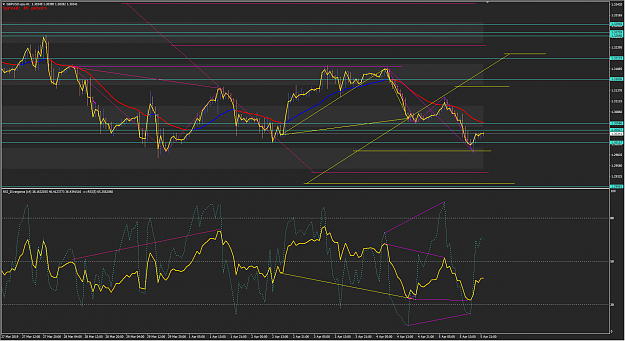
Here you go continuing that 1 hour chart. See how price has acted exactly as it should. Fails the average HH Test the average LL {image}
Ignored
Hi Alan,
How can you say "fails the average HH" while it not making average LL yet, for example?
So the right way to say "fails average HH" ONLY WHEN you see it made average LL, right?
I took the trade sell on the bar 12:00 H1 with inference is previous bar 11:00 closed below average and bar 12:00 opened right on the average.
{quote} Hi Alan, How can you say "fails the average HH" while it not making average LL yet, for example? So the right way to say "fails average HH" ONLY WHEN you see it made average LL, right? I took the trade sell on the bar 12:00 H1 with inference is previous bar 11:00 closed below average and bar 12:00 opened right on the average.
Ignored
This is unbelievable after all I have said. How on Earth can you get this so wrong!
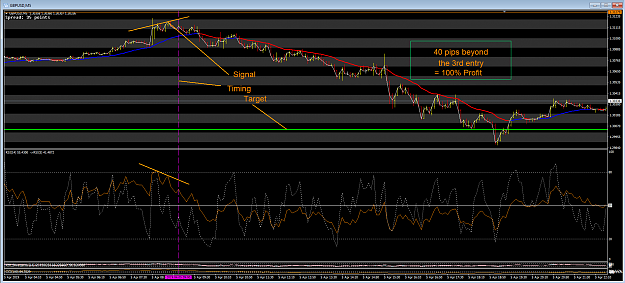
there was quite a nice reaction to the H1 ABCD 50% and the AB=CD {image}
Ignored
Not bad at all Jazz you have now progressed to having all three points on the ABCD wrongly placed.
A) You have not picked the highest high.
B) Does not line up with the RSI pivot, but you have picked the right one on the price.
C) Is wrong on the price and that point can't even be seen on the RSI, a pivot is blocking it.
{quote} Not bad at all Jazz you have now progressed to having all three points on the ABCD wrongly placed. A) You have not picked the highest high. B) Does not line up with the RSI pivot, but you have picked the right one on the price. C) Is wrong on the price and that point can't even be seen on the RSI, a pivot is blocking it.
{quote} This is unbelievable after all I have said. How on Earth can you get this so wrong!
Ignored
Hi Alan,
I may not express my idea clear enough.
I attached here my chart to explain what I am thinking clearer hopefully.
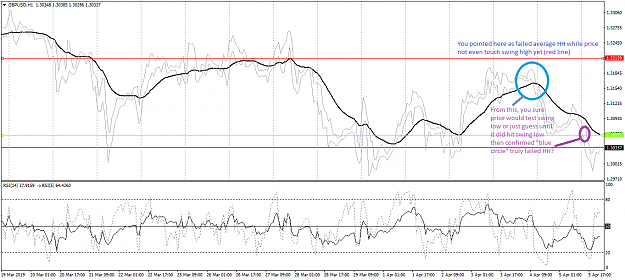
Basically my concern is which standards to identify a failed average HH or LL when things are still going on (when price not yet touch opposite site).
What you taught us were price touched swing high/low but average not yet. Then appear div or overbought/oversold on RSI as signal to tell us price may reverse and average may not find its target but would test opposite site so we call "average failed make HH/LL".
From my posted chart, you can see price not yet touch swing high so that it caused me concern.
Hi Folks,
Just a quick thank you to everyone contributing to this thread and to the explanations provided by Alan, the postings are a great resource and really help me get a grip on how to approach these markets.
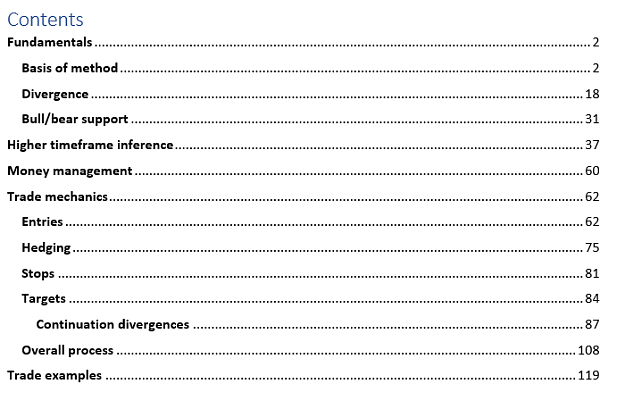
For those interested I've attached my crib notes for Alan's method, which essentially is a dump of many of Alan's and some other's posts to date. TOC is as follows:
Attached Image (click to enlarge)
This pdf file is 20MB so had to be split to upload here. 7-zip or Winzip should recombine them when files are placed in the same directory, and then extracting the 001 file. Because of another FF upload quirk, before doing this you have to delete the .zip at the end so file names before extraction should be:
Alan method posts.zip.001
Alan method posts.zip.002