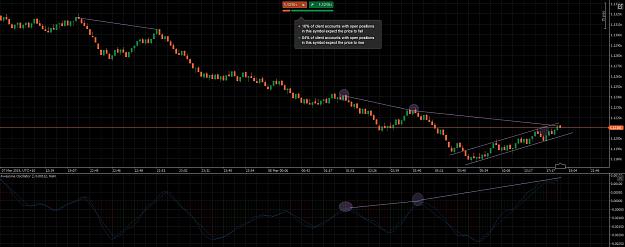
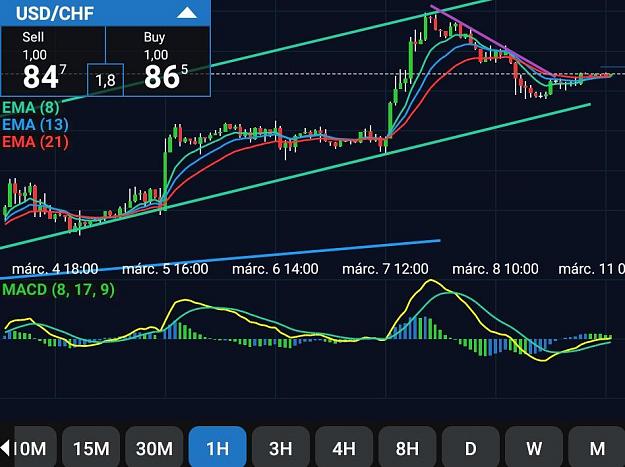
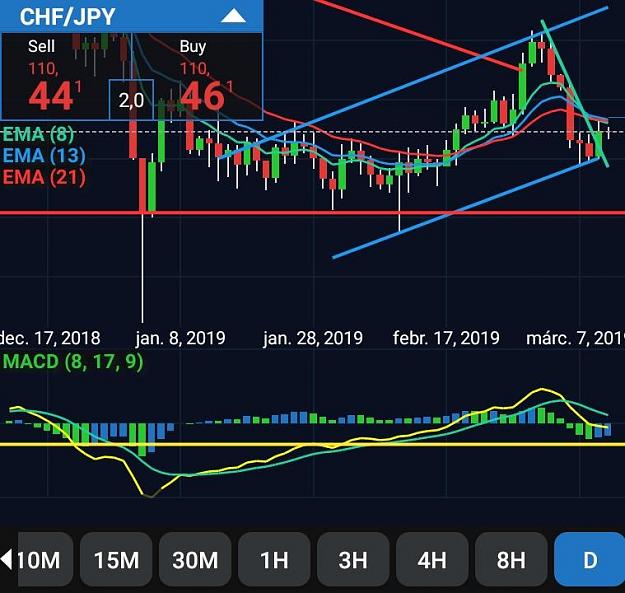
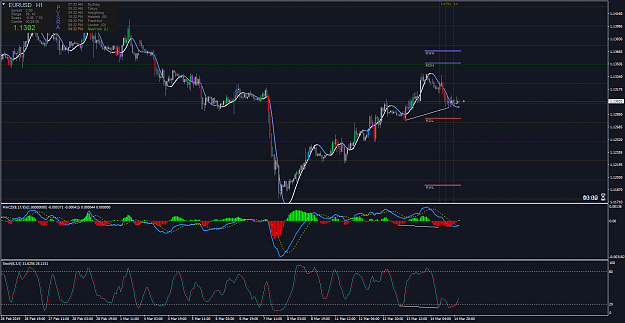
When this flag breaks, where do you think the Market Maker Liquidity Providers can safely assume the retail traders who are long have put their stops?
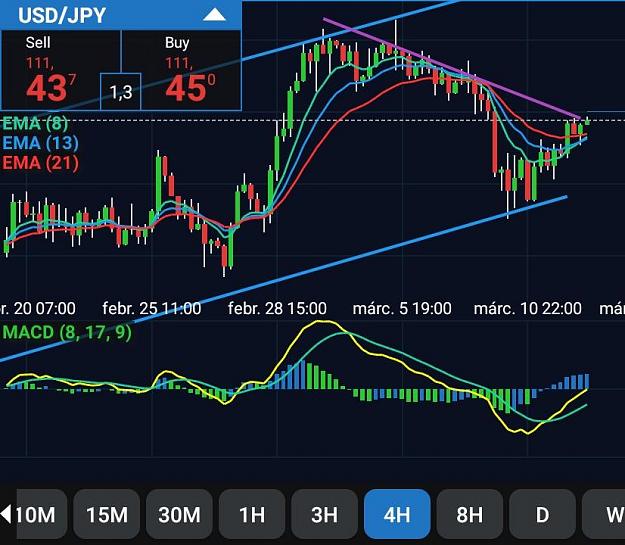
Who doesn't enjoy a good squeeze?
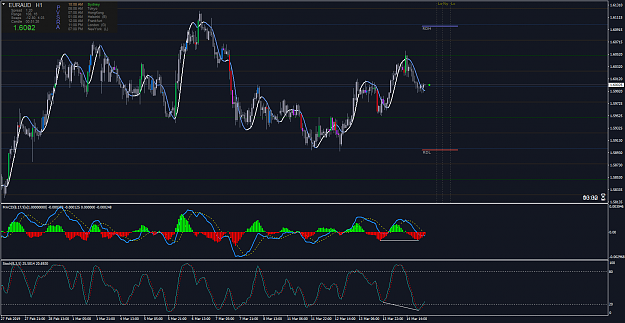
Divergence and hidden Divergence 122 replies
Hidden Pending Order and Hidden Trailing Stop Ea pls 4 replies
It's All About Hidden Divergence: Follow the trend 2 replies
Hidden Divergence 7 replies
Hidden Technical on Usd/Jpy 15 replies
DislikedUSDJPY could also be an opportunity. Bullish HD on daily TF, macd nearly crossed the 0 line on 4hr, price should also break above the trendline.{image}{image}Ignored
Disliked{quote} Hello Chamane. Can you tell me about your TP criteria?. Thank you.Ignored
Disliked{quote} Hi. I usually take profit when price reaches the same amount of my risk. Sometimes I bring my stop loss at breakeven + pips when I get half my risk and let price running.Ignored
Disliked{quote} When scanning for setups, do you start by looking for hidden divergences and after finding a good one, you move to a lower TF to start looking for regular divergence/macd zero cross/trend breaks?, or do you use that higher TF HD as a confirmation After finding a reversal pattern ? Also, do you have any preferred pairs for trading this method ? Thank you for your help Chamane.Ignored
Disliked{quote} Hi, I once firstly looked at the MACD cross of the zero line and confirm if there is a HD pattern on the larger TF, but I came back to look firstly for a HD pattern and switch to a lower TF for entries. Then I look for regular divergence, the MACD cross of the zero line and trendline break. Both ways can be done, but I prefer the latter. I scan all pairs that way and some other instruments like Gold and Silver. So I look for a HD pattern on mostly Monthly, Weekly, Daily and 4hr charts and enter trades on a shorter TF when I see one. If I...Ignored
Disliked{quote} Very clear explanation. For a 30m entry, the HD would be on the 4H TF ?. Like this: (HD - Entry) M - W W - D D - 4h 4h- 1h 4h - 30m 1h - 15m 15m - 5m 5m - 1m
Ignored
DislikedHere is an example of a hidden divergence pattern forming on the 1HR chart. I would then observe what is going on on the 15 min chart, waiting for criteria to be met (regular divergence, MACD crossing the zero line and price breaking the trendline). Patience is required as price could turn the other way. Note that the trend is clear on the 1HR chart, which is ideal. {image}Ignored
Disliked{quote} Here is how went the trade. It is important to show what doesn't work as well. There was a HD pattern on the 1HR chart, then we switch to the 15 min. We saw a regular divergence pattern, price broke a trendline down and MACD crossed the zero line downward for a signal to enter. But then price decided to turn around in the upward direction. At that time, I get out when MACD crosses back the zero line for a small loss. It often happens before the stop loss gets hit at the last swing, thus minimizing the loss. Also, there migth have been a...Ignored
Disliked{quote} Everyone loves to post their wins but a lot hide or give very little attention to losses, which could have valuable information to improve our trading. I like your reviewA similar question to my post above, but this time on your 15m chart, i find a bullish Regular Divergence right before your bearish Regular Divergence, that would make less effective your Regular Divergence or short position ? {image}
Ignored
Disliked{quote} You are right, it should be taken into consideration as the other signs I am using to confirm a trade. I rely more on the HD pattern on the higher timeframe wich is normally a stronger sign, in the direction of the trend. Furthermore, there was a regular divergence downward after the one you are pointing out and for me, it is enough to be comfortable entering the trade. It didn't work out, so it's important to minimize the loss in that case. Looking at the lower TF is only a method to pinpoint the entry.Ignored