{quote} Practice practice practice?? You're identifying a setup well outside the accumulation zone (i.e. 3 days later)...you sure you're doing that correctly?
Ignored
I would think that higher Time Frames of S/R would support past levels and setups..I could be wrong
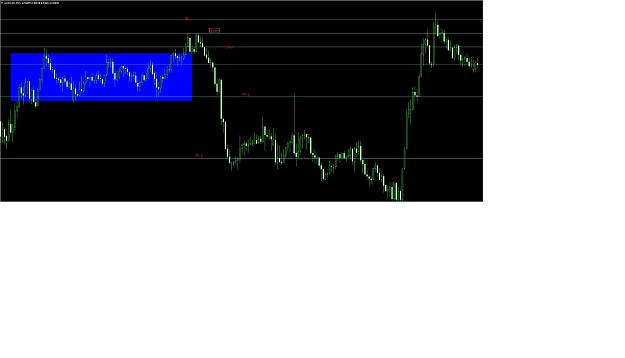
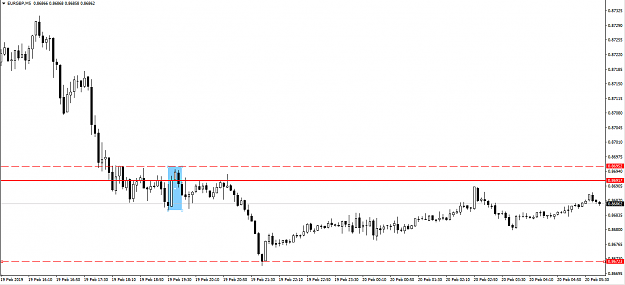
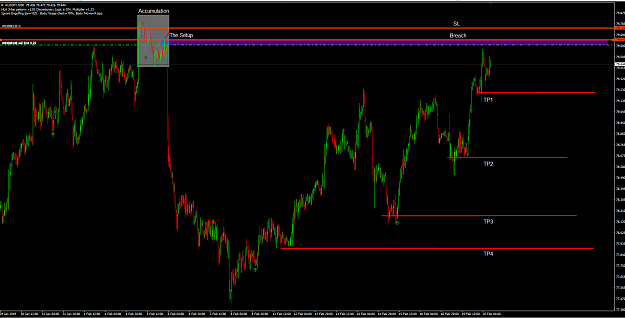
I'm still trying to get a better understanding of these set ups. I'm still trying to get a handle on direction based on the timeframes which you mentioned is all relative. ie might be downtrend on larger timeframes but uptrend on lower. On the AUDUSD trade it looks as if price accumulates then heads higher before coming back to the top of the zone area providing the set up. Can you provide me feedback as to where I went wrong on this analysis.
Attached Image (click to enlarge)
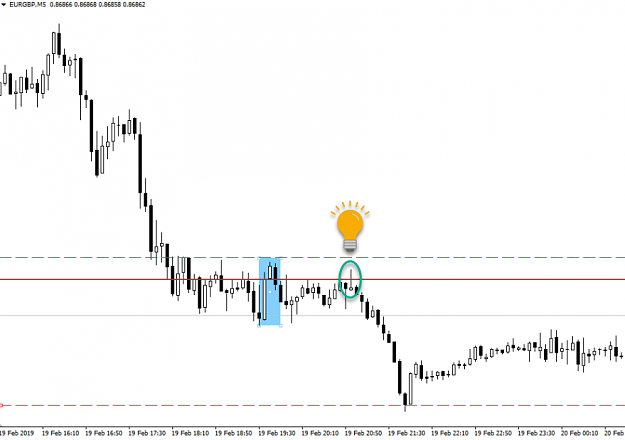
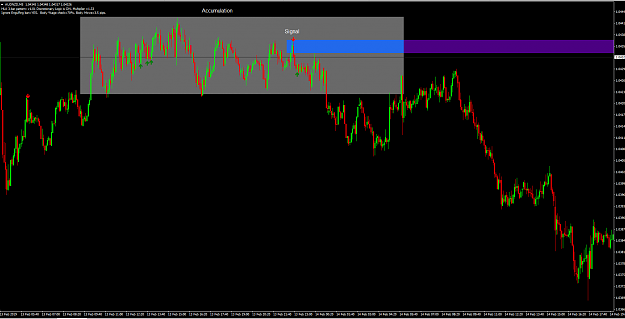
The second trade I took was on the GBPUSD. This trade worked out but again if you could provide feedback based on the set up in the 1m chart. I've also attached 5m to show overall picture
Attached Image (click to enlarge)
Attached Image (click to enlarge)
If you could also look at post 1963 from yesterday and comment that would be great.
Thanks FXCyborg for starting the thread and sharing your system. Looks really promising.
Wanted to see if I am understanding this one correctly, plz see attached.
Attached Image (click to enlarge)
So I am waiting for price to reach back to the solid red line, then short? (Assuming a down trend)
Thanks FXCyborg for starting the thread and sharing your system. Looks really promising. Wanted to see if I am understanding this one correctly, plz see attached. {image} So I am waiting for price to reach back to the solid red line, then short? (Assuming a down trend)
Ignored
I haven't a clue what I'm doing, yet. But WOW! so nice.
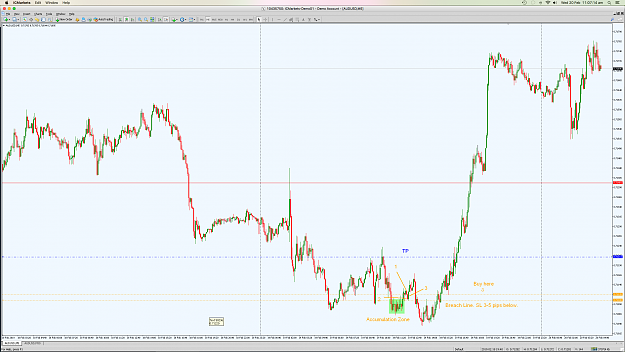
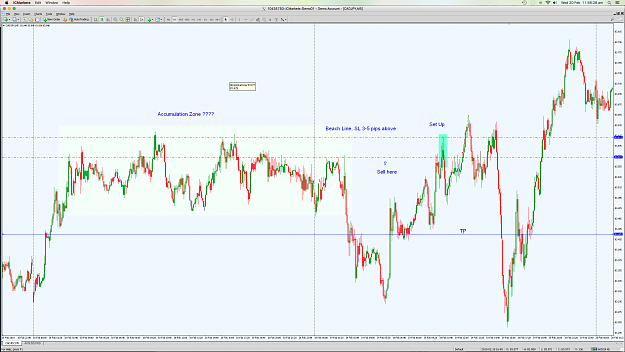
Here is another trade from yesterday. I closed the trade about 4 pips above breach line before it went in my direction. It would not have hit TP so was that the correct spot??
|
Additional Username
|
Joined Jul 2008
|114 Posts
Here is another trade from yesterday. I closed the trade about 4 pips above breach line before it went in my direction. It would not have hit TP so was that the correct spot??
Im not too sure on the methodology but when the setup occurred shouldnt you have been looking for longs as the 'short term' trend is long ??
FXC Here is another trade from yesterday. I closed the trade about 4 pips above breach line before it went in my direction. It would not have hit TP so was that the correct spot?? {image}
|
Membership Revoked
|
Joined Nov 2014
|1,911 Posts
Morning Everyone
I've just loaded my Photoshop, I'm going to draw out something that I think will really help you guys understand this a lot more easier. It'll be based off the Elliot Wave Analysis.
Hopefully for those struggling, the penny will drop now
ATB - BRB
Advanced Price Action Trader -MY STUFF IS FREE! JOIN ME!
Morning Everyone I've just loaded my Photoshop, I'm going to draw out something that I think will really help you guys understand this a lot more easier. It'll be based off the Elliot Wave Analysis. Hopefully for those struggling, the penny will drop now ATB - BRB
Morning Everyone I've just loaded my Photoshop, I'm going to draw out something that I think will really help you guys understand this a lot more easier. It'll be based off the Elliot Wave Analysis. Hopefully for those struggling, the penny will drop now ATB - BRB
I'm going to go to bed Ladies & Gentleman. I'll get back to these posts when I awake. Now, I may have some good news for you. A nice guy sent me a PM on here. He offered his services for FREE - from what I can see from his website, he knows his stuff He has offered to create an alert indi, based on how i do it. We'll keep you all posted as development takes place. Until then, well done to all of you, you're starting to pick it up now... i'll attend to the newer submitters amongst us and guide them on the right path when I awake....
Ignored
thank youu very muchh. been withdrawing ever since i started only using this method!
Morning Everyone I've just loaded my Photoshop, I'm going to draw out something that I think will really help you guys understand this a lot more easier. It'll be based off the Elliot Wave Analysis. Hopefully for those struggling, the penny will drop now ATB - BRB
Ignored
Thats a good news indeed.
Thanks a lot for all the work you are doing for us keeping your cool.
FXCyborg First of all, I want to thank you for your contribution.
I hope there are more people in the world like you.
I am a Taiwanese user. I don't know much about English, but I will try my best to express myself.
I have used this strategy for a week, but this is still an old saying. Trend is friend
Many times I still can't analyze the direction of the trend.
Only when the trend uses this strategy will the chances of success increase.
FXCyborg How do you tell the direction of the trend?
FXCyborg Thank you for wishing you can read this articleFXCyborg Thank you for wishing you can read this article
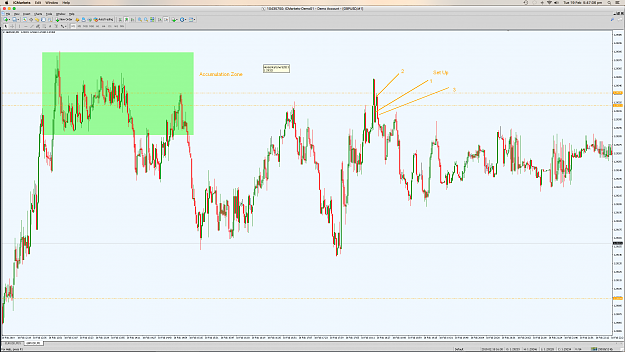
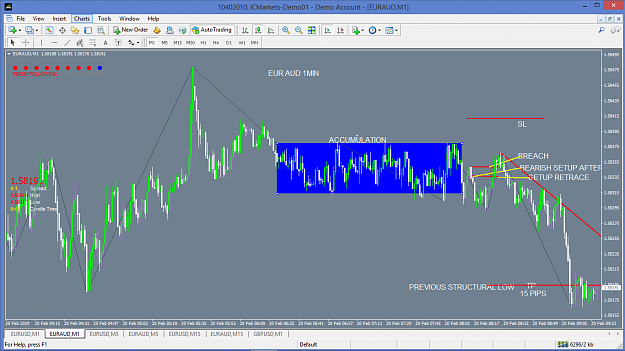
so i found this set up. the accumulation is there. downtrend on the 4hr. but the smallest timeframe i found the signal on was the 30m. does that make it invalid?
|
Membership Revoked
|
Joined Nov 2014
|1,911 Posts
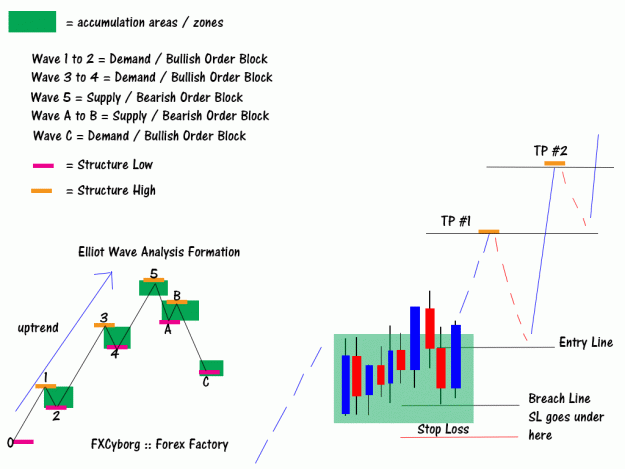
Elliot Wave Analysis Theory.
With Elliot Wave Analysis Theory we can deduce from its formation what will possibly happen next, not with a guarantee, but as a guideline.
We can use Harmonic Analysis with this as well, i.e, AB = CD Patterns, which is essentially Wave 0 to Wave 3, etc.
We can incorporate traditional Fibonacci Levels to it as well, i.e, 23.6%, 38.2%.
These are generally used for retracements predictions before Wave 3 is created while Wave 1 to 2 is being developed.
EX: Wave 0 to 1 length it's retracement will be be around 23.6% to 50% as wave 2 is complete before moving to the extended wave 3. Any retracements larger than this during Wave 0 to Wave 5 development are generally fake-outs to trap the market.
These only tend to have no more than 50% retracements for the most part in the uptrend forming Wave 0 to 5. The only time you'll see Levels of 61.8% and above retracement levels is when Wave 5 to A is being developed and when Wave B to C extension is being created. This is your flag to let you know the trend is reversing or imminent of a reversal.
We can further predict possible price movement by incorporating Banking Fibo Levels and Harmonic Fibo Levels as well, while adding Quarters Theory into the mix, i.e, 1.XX00, 1.XX20, 1.XX50, & 1.XX80 Plus Banking Fibo Levels as well.
Putting all these together along with Candlestick Analysis & line study analysis we get a confluence of events, this gives us evidence to support our trade idea to go long, or short. Without such evidence to support ones trade idea, one is purely gambling.
I'd rather have an Educated Guess, rather than uneducated one.
So, with that being said...
Image Explained:
Let's take a close look at this image below.
Green areas are our accumulation zones. This is a Bullish Elliot Wave Formation.
To the right hand side I drew in some candles, prepending a upwards trendline before we go into the accumulation zone.
As the accumulation zone is being built/developed, a Bullish Order Block are easily visible. At the start of the Accumulation we'll have a huge Bull Bar, while a ranging set of candles making no significant highs or lows will be seen thereafter. At the end of the accumulation zone we'll see another huge bull candle as it exits from the accumulation zone.
Buyers enter, orders are accumulated, then buyers exit ina rapid fashion, then come back to collect any missed orders and shoot off upwards. This is why I have said my entries are very responsive, they enter my Entry Line and Shoot off straight away with very LITTLE to NO Draw down at all.
As it shoots up and comes back, it creates a Structure High, hits our Entry line and takes off like a rocket - Price will ALWAYS test previous highs and lows.
We'll place our TP's at these levels, NOT on the wicks, but on the Body Close/Open of a two bar structure that forms the Structure High. Price responds to the closes more than the wicks high's or low's for an easier fill for our TP Targets.
Repeat and spin. And do the opposite for Sell orders.
What some of us here are making the mistake of, is selling into an uptrend... The ONLY time you can do this is knowing where we are in this formation, if we're at Wave 5, then yes, we can start to target pull backs to this level and locate sell orders before it shoots down to create Wave A.
This case is also true when Wave C is created, we'll be looking for Buys to create Wave 1. If wave B to C's length while creating wave 1 exceed approx 50% - 61.8% fibo, then we'll see another bullish Elliot Wave and it's previous Wave 5 formation price will be exceed. If it's lower, then we'll see a bearish Elliot Wave. At least from my observation. I'm not a EW Professional, it's far too time consuming to sit there and figure out all the wave retracement levels, I'd rather take the easier approach of the Skeleton that makes up the EW Formation.
I trust this helps?
ATB
Attached Image (click to enlarge)
Advanced Price Action Trader -MY STUFF IS FREE! JOIN ME!
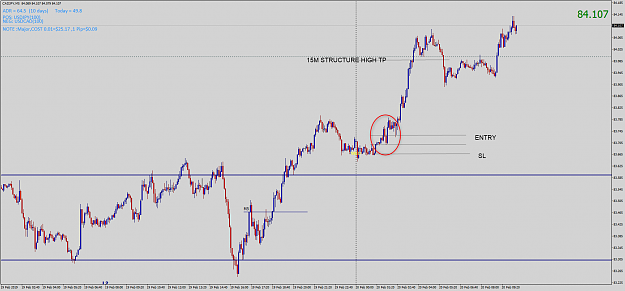
also this one i found on audnzd. first pic is accumulation and setup. second pic is setup getting reached and SL and TP levels. i put the TP at a more profitable structure but i am aware of the previous structures i skipped. i plan to move stop loss when i reach those levels. do these setups look valid? Thank you very much.!
Thank you for your post FXC,
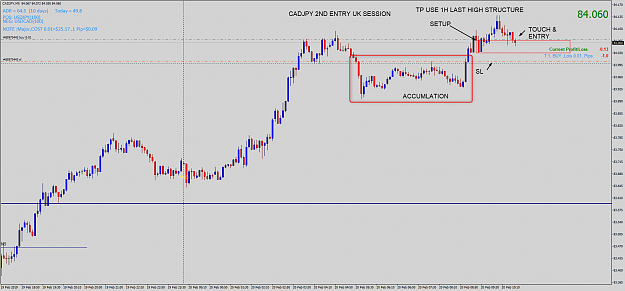
These my entry today ,Is it correct or just lock ?
Attached two charts / two entries
1st in Asia session
2nd in Uk session
Update:
1st Entry +30 Pips
2nd Entry was error i think because the bearish candle bodies not even close big difference between them. -5 Pips