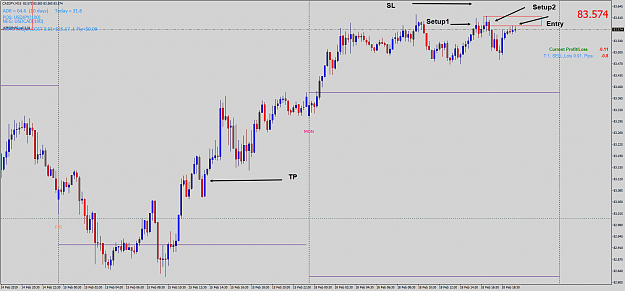
• Home
  • Forums
  • Trades
  • News
  • Calendar
  • Market
  • Brokers
  • Login
  • Join
  • User/Email: Password:
  • 8:12pm
Menu
  • Forums
  • Trades
  • News
  • Calendar
  • Market
  • Brokers
  • Login
  • Join
  • 8:12pm
Sister Sites
  • Metals Mine
  • Energy EXCH
  • Crypto Craft

Options

Bookmark Thread

First Page First Unread Last Page Last Post

Printable Version

Similar Threads

High Level Accuracy Method – “3-bar pattern Indicator/Alert” 256 replies

Tools for High Level Accuracy Method 7 replies

bo7a method... method for GBP/JPY 205 replies

MT4 Draw Symbol instead of Arrow, Draw n instead of square 2 replies

historical data accuracy puzzlement. 1 reply

  • Recycle Bin
  • /
  • Reply to Thread
  • Subscribe
  • 1,589
Attachments: High Level Accuracy Method With Little To NO Draw-down
Exit Attachments

High Level Accuracy Method With Little To NO Draw-down

  • Last Post
  •  
  • 1 9192Page 939495 202
  • 1 Page 93 202
  •  
  • Post #1,841
  • Quote
  • Feb 18, 2019 8:39am Feb 18, 2019 8:39am
  •  NevFX
  • Joined Apr 2018 | Status: Member | 363 Posts
Quoting majrou666
Disliked
{quote} Hi Geges, isn't it against the trend? I noticed the setup also but did not liked the second bull candle at at all so I left that one. I wish you get your profit though
Ignored
you'd have to define trend
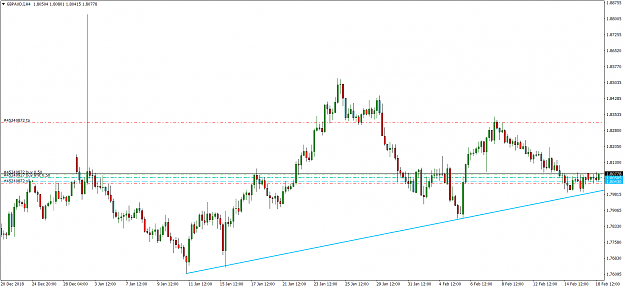
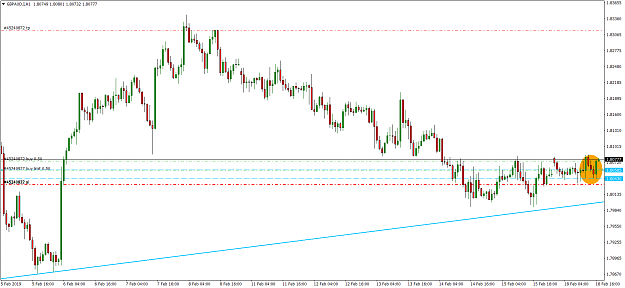
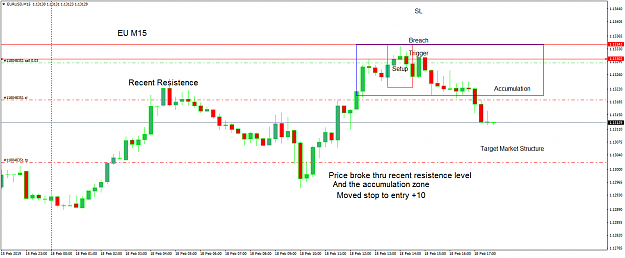
EURUSD has been making lower lows since the start of the year
1
  • Post #1,842
  • Quote
  • Edited at 8:57am Feb 18, 2019 8:44am | Edited at 8:57am
  •  statallin
  • | Joined Feb 2019 | Status: Member | 10 Posts
Idea trade that I took today.

If you were to look at this, there is clear accumulation at the left hand side. Setup appeared at the end of accumulation. Waited for the price to pull down. The sell setup would have been invalided otherwise (ie price moved up). Placed the pending order only after seeing that the price pulled down to a good level (subjective thing).

Price came back in short order to retest the area and I was in the trade. The TP is the structure low and it gets hit pretty fast as well. Nice, quick trade.

Attached Image (click to enlarge)
Click to Enlarge

Name: Screen Shot 2019-02-19 at 12.55.54 am.png
Size: 210 KB


If you were to look at the higher TF, like H1, this is a clear uptrend. But I took the trade nonetheless as higher TF trend does not really matter for M1. What matters more is the recent price action after the setup and accumulation together with ideal candle body sizes. If someone did a lot of backtesting and beg to differ please state it, I am learning new things everyday.

FXC does this follow your ideal blueprint and is there any way to improve upon this? Thank you for patiently helping out newbies like me.

Cheers and happy trading people!
4
  • Post #1,843
  • Quote
  • Feb 18, 2019 9:03am Feb 18, 2019 9:03am
  •  PayTheLimit
  • Joined Aug 2009 | Status: Ride the Pig | 31,000 Posts
4hr engulf south, 5min combo....think i'll give it a go...
Attached Images (click to enlarge)
Click to Enlarge

Name: USDCADH4.png
Size: 71 KB Click to Enlarge

Name: USDCADM5.png
Size: 84 KB
Look Sharp/Trade Tight
  • Post #1,844
  • Quote
  • Feb 18, 2019 9:04am Feb 18, 2019 9:04am
  •  GonMnemonik
  • | Joined Nov 2016 | Status: Member | 73 Posts
installation by usdsek
Attached Image (click to enlarge)
Click to Enlarge

Name: 222.png
Size: 14 KB
1
  • Post #1,845
  • Quote
  • Feb 18, 2019 9:35am Feb 18, 2019 9:35am
  •  ifeifeoluwa
  • | Joined Aug 2018 | Status: Junior Member | 2 Posts
Attached Image (click to enlarge)
Click to Enlarge

Name: EURUSDM1_Sell.png
Size: 29 KB
1
  • Post #1,846
  • Quote
  • Feb 18, 2019 9:38am Feb 18, 2019 9:38am
  •  gulaksarker
  • | Joined Dec 2013 | Status: Member | 33 Posts
Hope this one is correct. Lower compression doesn't have any setup. In my view this level is still fresh if I ignore the first touch right after the engulf occur.
Attached Image (click to enlarge)
Click to Enlarge

Name: Screenshot_1.jpg
Size: 163 KB
Learn or earn, never lose!
1
  • Post #1,847
  • Quote
  • Feb 18, 2019 9:55am Feb 18, 2019 9:55am
  •  ifeifeoluwa
  • | Joined Aug 2018 | Status: Junior Member | 2 Posts
WTI Sell Opportunity
Attached Image (click to enlarge)
Click to Enlarge

Name: USOILM5_Sell.png
Size: 36 KB
1
  • Post #1,848
  • Quote
  • Feb 18, 2019 10:11am Feb 18, 2019 10:11am
  •  Antony_sg
  • | Joined Oct 2013 | Status: Member | 107 Posts
Hi Mates
The pair GBPAUD have just valid setup, hope it boom tomorrow

Attached Image (click to enlarge)
Click to Enlarge

Name: GBPAUD.IH4.png
Size: 60 KB


H1 had good setup

Attached Image (click to enlarge)
Click to Enlarge

Name: GBPAUD.IH1.png
Size: 63 KB
1
  • Post #1,849
  • Quote
  • Feb 18, 2019 10:23am Feb 18, 2019 10:23am
  •  gulaksarker
  • | Joined Dec 2013 | Status: Member | 33 Posts
Quoting Antony_sg
Disliked
Hi Mates The pair GBPAUD have just valid setup, hope it boom tomorrow {image} H1 had good setup {image}
Ignored
Not a valid one. because the bullish bar engulf both 1st and 2nd bearish candle. It should engulf only the 2nd one.
Learn or earn, never lose!
  • Post #1,850
  • Quote
  • Feb 18, 2019 10:29am Feb 18, 2019 10:29am
  •  gulaksarker
  • | Joined Dec 2013 | Status: Member | 33 Posts
Quoting ifeifeoluwa
Disliked
WTI Sell Opportunity {image}
Ignored
It has revisited more times. You should sell then. In my view the level has been taken already. I am showing the best one. But wait for the answer of experts.
Attached Image (click to enlarge)
Click to Enlarge

Name: Screenshot_2.jpg
Size: 100 KB
Learn or earn, never lose!
1
  • Post #1,851
  • Quote
  • Feb 18, 2019 10:41am Feb 18, 2019 10:41am
  •  togr
  • | Joined Feb 2012 | Status: Member | 51 Posts
Quoting FXCyborg
Disliked
{quote} I'm sorry, you're not making any sense now. If you don't want to be constructive here, you can troll else where, there's plenty more threads you can do that. Take care. ATB
Ignored
Hi,

thank you for providing your know how. Unlike many others you are able to clearly explain your setup.
I have a question though,where should we enter the trade? Let's assume there is first bull bar, 2nd bull bar and 3rd bear bar.
Should I wait for bars to close to get the setup finished and then wait for next touch of the price?
I am adding image to make it more clear.
Attached Image (click to enlarge)
Click to Enlarge

Name: ques.jpg
Size: 127 KB
I like what I trade, I trade what I like
  • Post #1,852
  • Quote
  • Feb 18, 2019 10:45am Feb 18, 2019 10:45am
  •  fahedksa
  • | Joined Feb 2010 | Status: Member | 25 Posts
CADJPY - Sell
Update : Exit looks like wrong decision.
Attached Image (click to enlarge)
Click to Enlarge

Name: CADJPYM5.png
Size: 53 KB
1
  • Post #1,853
  • Quote
  • Feb 18, 2019 10:50am Feb 18, 2019 10:50am
  •  Antony_sg
  • | Joined Oct 2013 | Status: Member | 107 Posts
Quoting gulaksarker
Disliked
{quote} Not a valid one. because the bullish bar engulf both 1st and 2nd bearish candle. It should engulf only the 2nd one.
Ignored
@Gulaksarker: Really? I think this engulfing bar show strong reversal. Turn to H4 chart, you can see the chart had 2 engulfing bars, wait for this H4 bar complete will see 3 engulfing candles.
Chart still go up the trend
  • Post #1,854
  • Quote
  • Feb 18, 2019 10:51am Feb 18, 2019 10:51am
  •  Geges
  • | Joined Dec 2009 | Status: Member | 138 Posts
Quoting Geges
Disliked
{image}
Ignored
Attached Image (click to enlarge)
Click to Enlarge

Name: EURUSDM15 2-18-2019 (2).png
Size: 42 KB
1
  • Post #1,855
  • Quote
  • Feb 18, 2019 10:52am Feb 18, 2019 10:52am
  •  Boo15
  • | Joined May 2018 | Status: Forever Hopeful!! | 163 Posts
Quoting togr
Disliked
{quote} Hi, thank you for providing your know how. Unlike many others you are able to clearly explain your setup. I have a question though,where should we enter the trade? Let's assume there is first bull bar, 2nd bull bar and 3rd bear bar. Should I wait for bars to close to get the setup finished and then wait for next touch of the price? I am adding image to make it more clear. {image}
Ignored

All you need to know can be found in the first post, this question has been answered many times throughout this thread
From tiny pips mighty oaks grow
1
  • View Post
  • Disliked by Thread Starter
  • menek
  • Post #1,857
  • Quote
  • Feb 18, 2019 11:12am Feb 18, 2019 11:12am
  •  kylehaman
  • | Joined Jun 2018 | Status: Member | 20 Posts
The gray box is what I thought to be an accumulation area on 15M chart, no setups though. Went down to a 1M chart and this is what I found. Thank you for your time and passing along this great information.
Attached Image (click to enlarge)
Click to Enlarge

Name: NC 1M.JPG
Size: 219 KB
1
  • View Post
  • Disliked by Thread Starter
  • CrocodileRex
  • Post #1,859
  • Quote
  • Feb 18, 2019 11:24am Feb 18, 2019 11:24am
  •  kylehaman
  • | Joined Jun 2018 | Status: Member | 20 Posts
Would you like to see a stronger engulfing candle or is this valid?
Attached Image (click to enlarge)
Click to Enlarge

Name: GU 1M.JPG
Size: 210 KB
1
  • Post #1,860
  • Quote
  • Feb 18, 2019 1:03pm Feb 18, 2019 1:03pm
  •  fahedksa
  • | Joined Feb 2010 | Status: Member | 25 Posts
CADJPY - SELL - 15M
What you think friends about these entry:
Actually i made many mistakes in & out but just practicing ,what confuse me that looks like we have 2 setup?
Attached Image (click to enlarge)
Click to Enlarge

Name: CADJPYM153.png
Size: 54 KB
1
  • Recycle Bin
  • /
  • High Level Accuracy Method With Little To NO Draw-down
  • Reply to Thread
    • 1 9192Page 939495 202
    • 1 Page 93 202
0 traders viewing now
  • More
Top of Page
  • Facebook
  • Twitter
About FF
  • Mission
  • Products
  • User Guide
  • Media Kit
  • Blog
  • Contact
FF Products
  • Forums
  • Trades
  • Calendar
  • News
  • Market
  • Brokers
  • Trade Explorer
FF Website
  • Homepage
  • Search
  • Members
  • Report a Bug
Follow FF
  • Facebook
  • Twitter

FF Sister Sites:

  • Metals Mine
  • Energy EXCH
  • Crypto Craft

Forex Factory® is a brand of Fair Economy, Inc.

Terms of Service / ©2021