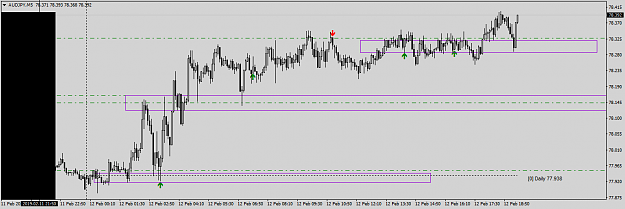
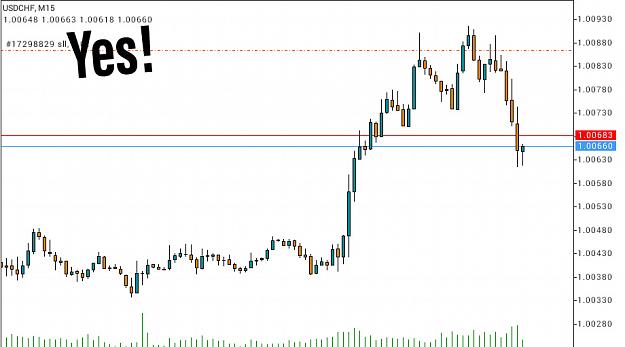
Update to the USDCHF setup I shared earlier. I actually took the trade. I dare add that sometimes we can even deduce when a temporary top or bottom is in place when signals become abundant in same area.
USDCHF 15mins
USDCHF 15mins
4
High Level Accuracy Method – “3-bar pattern Indicator/Alert” 481 replies
Tools for High Level Accuracy Method 7 replies
bo7a method... method for GBP/JPY 205 replies
MT4 Draw Symbol instead of Arrow, Draw n instead of square 2 replies
Disliked{quote} There is no engulfing bar that I can see, and I personally like to see the engulfing bar engulf bar #2 by at least 25-50%, and I am only talking about the bodies now. So lets say that this is a Buy set up, and that bar #1 candle body is 20 pips, bar #2 candle body is 18 pips. So the engulfing bar should totally engulf bar #1, and close somewhere around the quarter to middle area of bar #2. So if it engulfs bar #1 by only 1-2 pips, then to me its not a strong set up, but FX Cyborg can confirm this or not.Ignored
DislikedHello All........I am new to this thread but am really struggling with one point: does the trend matter or not? I'm an intelligent fellow. I read the words. I understand the words. And I think I've got it. And then comes along chart examples that show the opposite of what I've read and are still considered valid. This is a very, very interesting method but this confusion is causing me considerable frustration. On the two attached charts (from waaay back at post 34 and post 46), FXCyborg responded that these were both valid SELL setups, but both...Ignored
Disliked{quote} The trend on the NZDJPY H1 was clearly up, so this Sell is not correct as far as I can see, and it was also a failed trade. At what point would you start selling, I would say on Feb 7 because its obvious that Feb 6 was a change in trend with it being a down day, but we need FX Cyborgs input on this one.Ignored
Disliked{quote} Right. FXC called the NZDJPY setup valid in post 53. And he called the EURCAD setup I mentioned earlier valid in post 59. So I'm left confused; not angry, doubting or negative, just confused.Ignored
DislikedHello All........I am new to this thread but am really struggling with one point: does the trend matter or not? I'm an intelligent fellow. I read the words. I understand the words. And I think I've got it. And then comes along chart examples that show the opposite of what I've read and are still considered valid. This is a very, very interesting method but this confusion is causing me considerable frustration. On the two attached charts (from waaay back at post 34 and post 46), FXCyborg responded that these were both valid SELL setups, but both...Ignored
Disliked{quote} Right. FXC called the NZDJPY setup valid in post 53. And he called the EURCAD setup I mentioned earlier valid in post 59. So I'm left confused; not angry, doubting or negative, just confused.Ignored
DislikedSo I built a basic indicator to highlight possible engulfing patterns. Now it is not sophisticated enough to only highlight the perfect setup, it just does the bare minimum. So what is the point? The point was to highlight to me where a possible set up could occur - in these examples on the H1 time frame. It gives me a little arrow at the open of the next candle should the basic engulfing body pattern appear in the previous 3 candles. What do I do next? This is where some experience comes in. Essentially, you have to look at time of day, size of...Ignored