• Home
  • Forums
  • Trades
  • News
  • Calendar
  • Market
  • Brokers
  • Login
  • Join
  • User/Email: Password:
  • 7:12pm
Menu
  • Forums
  • Trades
  • News
  • Calendar
  • Market
  • Brokers
  • Login
  • Join
  • 7:12pm
Sister Sites
  • Metals Mine
  • Energy EXCH
  • Crypto Craft

Options

Bookmark Thread

First Page First Unread Last Page Last Post

Print Thread

Similar Threads

High Level Accuracy Method – “3-bar pattern Indicator/Alert” 327 replies

Tools for High Level Accuracy Method 7 replies

bo7a method... method for GBP/JPY 205 replies

MT4 Draw Symbol instead of Arrow, Draw n instead of square 2 replies

historical data accuracy puzzlement. 1 reply

  • Recycle Bin
  • /
  • Reply to Thread
  • Subscribe
  • 1,592
Attachments: High Level Accuracy Method With Little To NO Draw-down
Exit Attachments

High Level Accuracy Method With Little To NO Draw-down

  • Last Post
  •  
  • 1 67Page 8910 202
  • 1 Page 8 202
  •  
  • Post #141
  • Quote
  • Edited at 4:13pm Feb 3, 2019 4:01pm | Edited at 4:13pm
  •  Techanalyst
  • | Membership Revoked | Joined Jul 2020 | 7,294 Posts
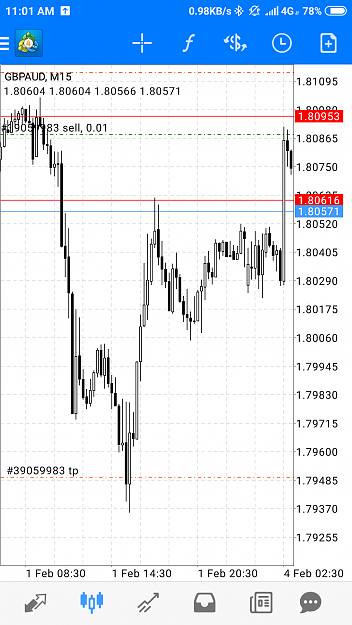
Possible move on USDCHF. If it breaks and goes above 0.9963, we wait for the pullback and will be looking for buy opportunity. As for now I am looking at that level, and if it goes back down im selling.

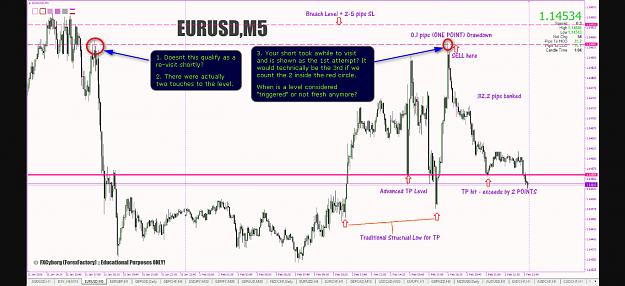
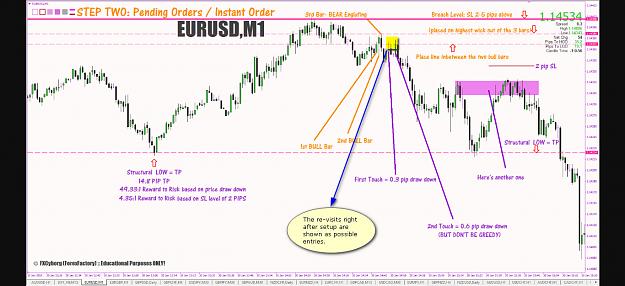
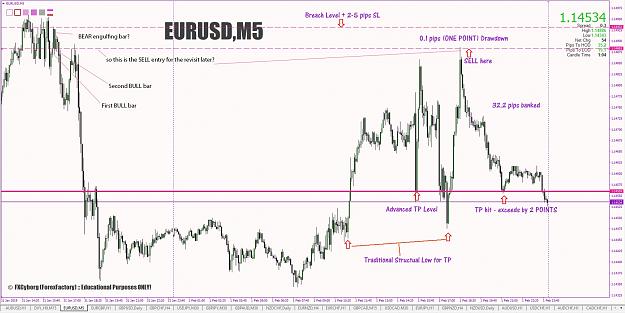
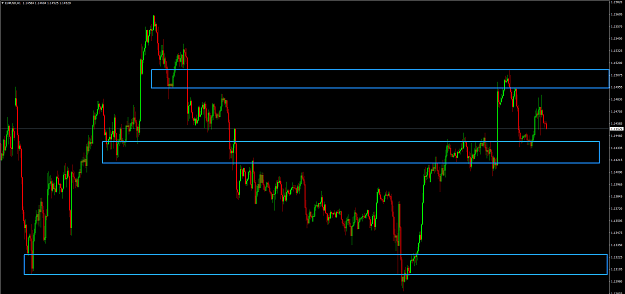
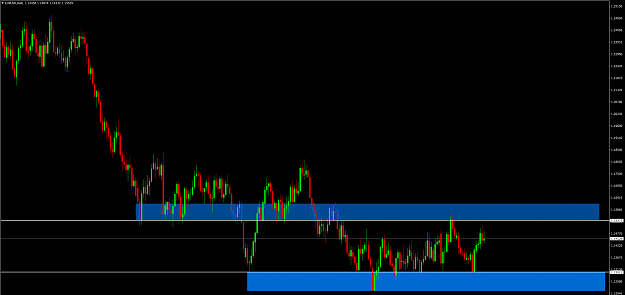
EURUSD chart also on here.
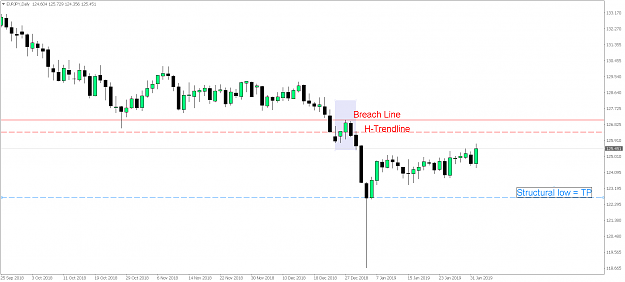
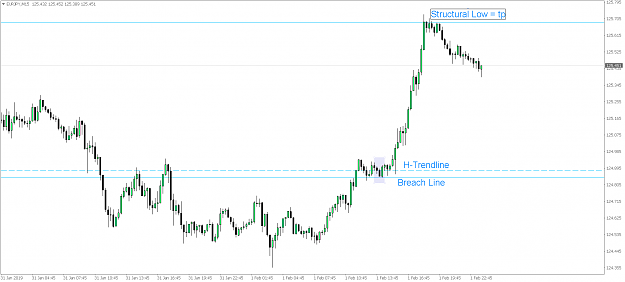
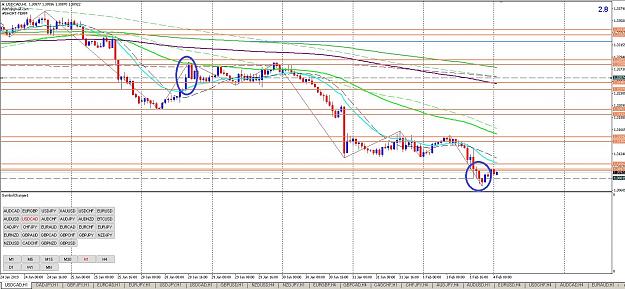
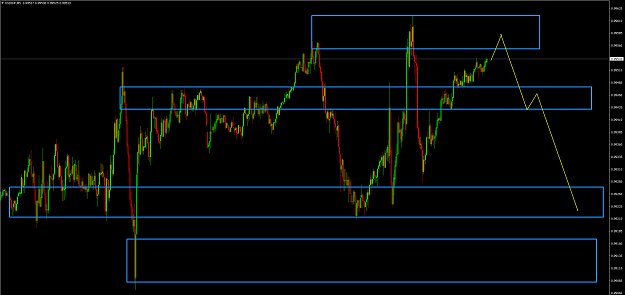
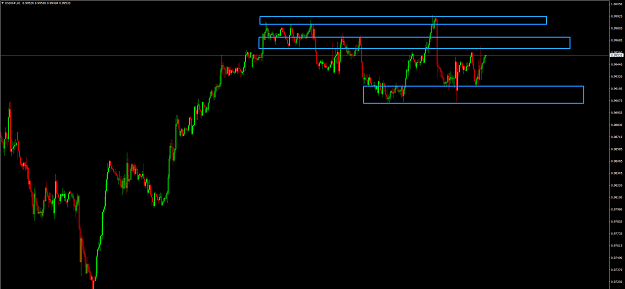
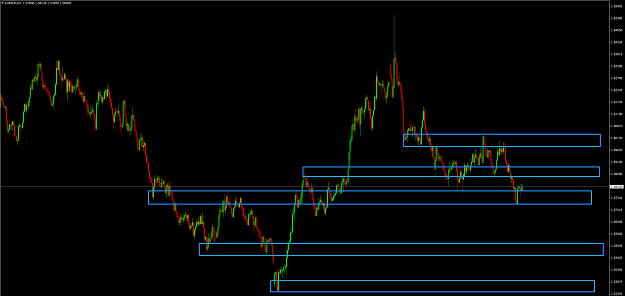
EURAUD.
Attached Images (click to enlarge)
Click to Enlarge

Name: USDCHFM5.png
Size: 40 KB Click to Enlarge

Name: USDCHFH1.png
Size: 38 KB Click to Enlarge

Name: EURUSDH1.png
Size: 38 KB Click to Enlarge

Name: EURAUDH4.png
Size: 39 KB
Click to Enlarge

Name: EURUSDDaily.png
Size: 35 KB
2
3
  • Post #142
  • Quote
  • Feb 3, 2019 4:12pm Feb 3, 2019 4:12pm
  •  drsa1970
  • | Joined Feb 2018 | Status: Member | 247 Posts
Hi FxCybo,
Thanks for sharing your great strategy here.
would you please keep attached the screenshots submitted by other member while you replying and analyzing their setups?so that we do not need to go back to original post for screenshot; result in better understanding and time saving as well.

Thank you
If you don't build your DREAM, Someone will hire to help build theirs ...
1
3
  • Post #143
  • Quote
  • Edited at 4:34pm Feb 3, 2019 4:14pm | Edited at 4:34pm
  •  dragos_
  • | Joined Feb 2013 | Status: Member | 335 Posts
Quoting FXCyborg
Disliked
{quote} ...identify TWO BULL BARS then a BEAR bar for a SELL setup, the BEAR Bar's BODY, MUST engulf the 2nd BULL Bars Body. Once you have, do the following: 1) Place your H-Trendline in the middle of the two BULL BARS (on its first bar's close and 2nd bar's open). This is your ENTRY trigger as price comes back for a revisit. 2) Find the highest Wick out of all 3 bars - place a H-Trendline in there. This will act as your Breach Line. Then place your SL above there. 3) Find the most RECENT structural LOW for these sell setups... this will act as...
Ignored
Hi FXCyborg,

Could you please say if this qualifies as a valid setup based on your rules, and if not what are the reasons?
Attached Image (click to enlarge)
Click to Enlarge

Name: EURJPYDaily.png
Size: 40 KB


Moreover I would like to mention that I am not very clear with Structural low.
It would be helpful if you elaborate a bit on how you find Structural low and where exactly you place the TP line, and what is the rationale behind it as per your knowledge (if you mentioned it already I may have missed it - just let me know and I'll look it up).

Thank you,
Dragos
 
1
  • Post #144
  • Quote
  • Feb 3, 2019 4:25pm Feb 3, 2019 4:25pm
  •  reinis92
  • | Joined Oct 2016 | Status: VIP | 11 Posts
Thank you for posting this idea. Could you please explain a little bit more in detail, what should happen before the candlestick pattern?

In the main post you wrote:
Quote
Disliked
What we are looking for is an area where price has accumulated orders. Essentially were price was not really making any significant highs or lows - basically going sideways from a standing view point.

But then in some graphics, you pointed out the candlestick pattern with no previous price accumulation. For example - the last two graphics in the main post ( EURUSD, M15 and EURUSD, M30).

Thank you in advance!
An investment in knowledge pays the best interest.
 
2
  • Post #145
  • Quote
  • Edited at 5:10pm Feb 3, 2019 4:32pm | Edited at 5:10pm
  •  dragos_
  • | Joined Feb 2013 | Status: Member | 335 Posts
Quoting FXCyborg
Disliked
{quote} ... Please identify TWO BULL BARS then a BEAR bar for a SELL setup, the BEAR Bar's BODY, MUST engulf the 2nd BULL Bars Body. Once you have, do the following: 1) Place your H-Trendline in the middle of the two BULL BARS (on its first bar's close and 2nd bar's open). This is your ENTRY trigger as price comes back for a revisit. 2) Find the highest Wick out of all 3 bars - place a H-Trendline in there. This will act as your Breach Line. Then place your SL above there. 3) Find the most RECENT structural LOW for these sell setups... this will...
Ignored
And one more, allthough I think is not fresh. Looking forward for your feedback, thanks
Attached Image (click to enlarge)
Click to Enlarge

Name: EURJPYM15.png
Size: 45 KB
 
1
  • Post #146
  • Quote
  • Feb 3, 2019 4:42pm Feb 3, 2019 4:42pm
  •  fxLoveLots
  • | Joined Feb 2019 | Status: Member | 51 Posts
Hello Cyborg.
I just created an FF account just to comment here.
I appreciate you sharing your wealth of knowledge and experience here.
I'm impressed and am very happy to learn from a professional trader.
Ignore the trolls.
Carry on an be awesome.
Thanks, your student.
-fxLoveLots
1
3
  • Post #147
  • Quote
  • Feb 3, 2019 5:22pm Feb 3, 2019 5:22pm
  •  digiff
  • Joined Jun 2010 | Status: Member | 523 Posts
Quoting FXCyborg
Disliked
Once we have found / identified this area we are looking for a revisit back to that zone - it must revisit back to this zone in short order (come back reasonably quick) - if it takes far too long to come back to that area it's generally best to ignore the setup.
Ignored
FC, thanks for taking the time to freely share your knowledge from your vast experience. Before I post my charts, I have a couple of questions/confusion about where you consider to actually place the order. I am clear about the 3 bar setup, just not the entry points. I used your charts from the first post to annotate the confusion.

Attached Image (click to enlarge)
Click to Enlarge

Name: EU 5 fx.jpg
Size: 224 KB

Attached Image (click to enlarge)
Click to Enlarge

Name: eu 15 fx.jpg
Size: 191 KB

Attached Image (click to enlarge)
Click to Enlarge

Name: eu 30 fx.jpg
Size: 155 KB

Attached Image (click to enlarge)
Click to Enlarge

Name: eu 1 fx.jpg
Size: 217 KB
In other news: A ranger was trapped between a bull and a bear
 
7
  • Post #148
  • Quote
  • Feb 3, 2019 5:40pm Feb 3, 2019 5:40pm
  •  Kei78
  • | Joined Nov 2015 | Status: Member | 20 Posts
This is refreshing to see a thread with clean charts and with extreme value. It's pretty rare these days, so thanks Mr. X!
"An investment in knowledge pays the most interest."
1
1
  • Post #149
  • Quote
  • Feb 3, 2019 5:46pm Feb 3, 2019 5:46pm
  •  MrGreen95
  • Joined Jan 2018 | Status: Member | 1,108 Posts
Quoting FXCyborg
Disliked
{quote} @MrGreen95 Hello Sir, thanks for your suggestion. Not a bad idea. However, the more charts you have open and more algo sets running in the background has a tendency to slow ones PC down of much needed resources. I would suggest to run a search on this forum a for a trendline alert indicator - Once you find the setup in question, add a H-trendline and mark it / label it "sell" or "buy" and as price reaches that trigger level, you will be alerted. I have a similar one, but my script hides my order from the Brokers and auto trail steps...
Ignored

Hello Sir, don't call me Sir, please!

I understand what you're saying, but i mean to open only one chart with the dashboard that analyzes all pairs and TF. So, you just need one chart and in this case we'll don't have to slow our PC: i find this way more easy and stressless, just wait the alert and then we can open the second chart with the setup..

Anyway, this could be an opportunity, right?

EURAUD / H4:
Attached Image (click to enlarge)
Click to Enlarge

Name: EA.PNG
Size: 34 KB
 
1
  • Post #150
  • Quote
  • Feb 3, 2019 6:04pm Feb 3, 2019 6:04pm
  •  kieranmurphy
  • | Joined Feb 2017 | Status: Member | 13 Posts
Hi
I just want to say that your comments and contributions are most appreciated and refreshing. I have thoroughly enjoyed Sunday evening here drawing my charts based on your teaching and ready to trade on a demo account and perfect your method. Thank you and best wishes
Kieran in Dublin
1
2
  • Post #151
  • Quote
  • Feb 3, 2019 6:15pm Feb 3, 2019 6:15pm
  •  Yoshibomb
  • | Joined Feb 2018 | Status: Member | 50 Posts
ok, first blue circle on the left looks good to me, engulfing and two candles has enough healthy almost equal size.

the right blue circle has good setup also but need more healthier body size i guess.
Attached Image (click to enlarge)
Click to Enlarge

Name: pic.JPG
Size: 356 KB
 
1
  • Post #152
  • Quote
  • Edited at 7:04pm Feb 3, 2019 6:23pm | Edited at 7:04pm
  •  lddd
  • Joined May 2009 | Status: Member | 2,986 Posts
Quote
Disliked
What we are looking for is an area where price has accumulated orders. Essentially were price was not really making any significant highs or lows - basically going sideways from a standing view point.

Once we have found / identified this area we are looking for a revisit back to that zone - it must revisit back to this zone in short order (come back reasonably quick) - if it takes far too long to come back to that area it's generally best to ignore the setup.

Hey there. Good topic. Here's a newbie question.

How do you determine whats "far to long" to come back to the consolidation area for a revisit? What ist long what is quick? Some example? Isn't that relative to what time frame you look at and therefor how much time is spend for each new candle.

Also could you recommend where to start here as a complete newbie to forward practice these entry setups. I would like to mainly trade the EU session without having to watch multiple markets for multiple time frames at once.

I see you post charts for all kind of different time frames and markets so i am bit confused. To me something like a trading plan i could build around such strategy would help, like what markets to trade, what time frame to focus on. If i have to do any kind of multiple time frame analyse to first identify the longer term trend so for e.g if looking for setups on M15 do i have to look at H1, and so on. These are the main things i still have to struggle a lot with, appreciate any kind of help here.

And could you tell me if i locate the 1-2-3 bear engulfing setup on the chart you posted correctly? I tried to draw in

Attached Image (click to enlarge)
Click to Enlarge

Name: question.jpg
Size: 205 KB
 
1
  • Post #153
  • Quote
  • Feb 3, 2019 7:20pm Feb 3, 2019 7:20pm
  •  Lindall
  • | Joined Jan 2019 | Status: Member | 9 Posts
Thank you
1
1
  • Post #154
  • Quote
  • Feb 3, 2019 7:36pm Feb 3, 2019 7:36pm
  •  havo
  • Joined Jan 2016 | Status: Member | 529 Posts
This is actually buying/selling the first correction in a established trend wich its WAY better/more consistent/reliable/accurate than trying to find a turn around/swing point for placing a trade (what people like to call "swing trading" lol).. Its a Good reliable method; i actually do the same but with a different type of chart

Good luck to everyone because its well worth it =)
 
5
  • Post #155
  • Quote
  • Feb 3, 2019 8:19pm Feb 3, 2019 8:19pm
  •  lddd
  • Joined May 2009 | Status: Member | 2,986 Posts
Quoting reinis92
Disliked
Thank you for posting this idea. Could you please explain a little bit more in detail, what should happen before the candlestick pattern? In the main post you wrote: {quote} But then in some graphics, you pointed out the candlestick pattern with no previous price accumulation. For example - the last two graphics in the main post ( EURUSD, M15 and EURUSD, M30). Thank you in advance!
Ignored
Same questions here. On some of the charts posted such previous price accumulation is missing somehow? As far as i did understand correct this is essential. So you not simply identify such setups during an extreme level during some intact up or downtrend, right? Further this leads me to the question how you determine what a side ways market has to look like depending on the time frame you're looking. If you say accumulation/sideways is where price is not making new highs or lows, for how long this has to be? So for some this might be a period of some candles movement, for some this might be a multiple series of swings could not make significant new highs or lows.

Sorry if these are newbie questions again, i am still learning
 
3
  • Post #156
  • Quote
  • Edited Feb 4, 2019 3:02am Feb 3, 2019 8:23pm | Edited Feb 4, 2019 3:02am
  •  kiwi_trader
  • Joined Dec 2006 | Status: Member | 182 Posts
Thanks for an interesting thread FxCyborg.

Have you considered the possibility of more than 2 bars. It seems that a first and a last bar that meet your criteria (relatively large bodies of similar size) with a number of short body bars in between also provide a good anchor for a trade when the final bar is eclipsed.
1
 
  • Post #157
  • Quote
  • Feb 3, 2019 10:04pm Feb 3, 2019 10:04pm
  •  Jackpain
  • | Joined Jan 2019 | Status: Junior Member | 3 Posts
Is this entry correct?the early entry was due to spread and the red line is where i took my trade.thanks for the feedback.
Attached Image (click to enlarge)
Click to Enlarge

Name: Screenshot_2019-02-04-11-01-20-337_net.metaquotes.metatrader4.png
Size: 157 KB
1
1
  • Post #158
  • Quote
  • Feb 3, 2019 11:02pm Feb 3, 2019 11:02pm
  •  Yoshibomb
  • | Joined Feb 2018 | Status: Member | 50 Posts
Quoting Jackpain
Disliked
Is this entry correct?the early entry was due to spread and the red line is where i took my trade.thanks for the feedback. {image}
Ignored

i dont see any engulfing??

if the left upper corner is the setup, the tp was already reached i guess...
1
1
  • Post #159
  • Quote
  • Feb 3, 2019 11:21pm Feb 3, 2019 11:21pm
  •  Hooman86
  • | Joined Sep 2018 | Status: Member | 129 Posts
Quoting digiff
Disliked
{quote} FC, thanks for taking the time to freely share your knowledge from your vast experience. Before I post my charts, I have a couple of questions/confusion about where you consider to actually place the order. I am clear about the 3 bar setup, just not the entry points. I used your charts from the first post to annotate the confusion. {image} {image} {image} {image}
Ignored

Likewise same thoughts.
1
1
  • Post #160
  • Quote
  • Feb 3, 2019 11:27pm Feb 3, 2019 11:27pm
  •  FXCyborg
  • | Membership Revoked | Joined Nov 2014 | 1,911 Posts
Quoting bobshah
Disliked
Hello FXCyborg, just subscribed to your thread , hope to learn your trading method, thanks,
Ignored
@bobshah, Hi

Welcome to the thread

ATB
Advanced Price Action Trader -MY STUFF IS FREE! JOIN ME!
1
1
  • Recycle Bin
  • /
  • High Level Accuracy Method With Little To NO Draw-down
  • Reply to Thread
    • 1 67Page 8910 202
    • 1 Page 8 202
0 traders viewing now
  • More
Top of Page
  • Facebook
  • Twitter
About FF
  • Mission
  • Products
  • User Guide
  • Media Kit
  • Blog
  • Contact
FF Products
  • Forums
  • Trades
  • Calendar
  • News
  • Market
  • Brokers
  • Trade Explorer
FF Website
  • Homepage
  • Search
  • Members
  • Report a Bug
Follow FF
  • Facebook
  • Twitter

FF Sister Sites:

  • Metals Mine
  • Energy EXCH
  • Crypto Craft

Forex Factory® is a brand of Fair Economy, Inc.

Terms of Service / ©2022