I may have allready posted this once . This is very very important so it needs to be ingrained in your mind the first rattle out the box when you look
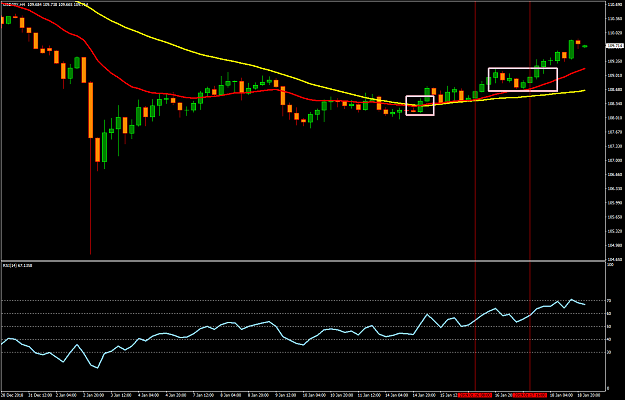
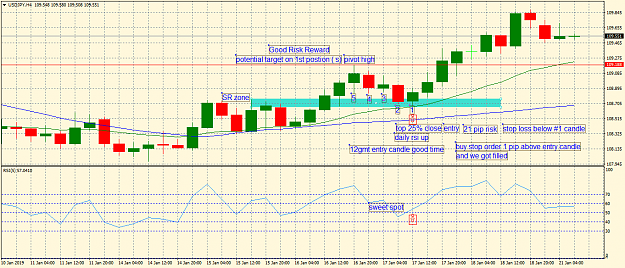
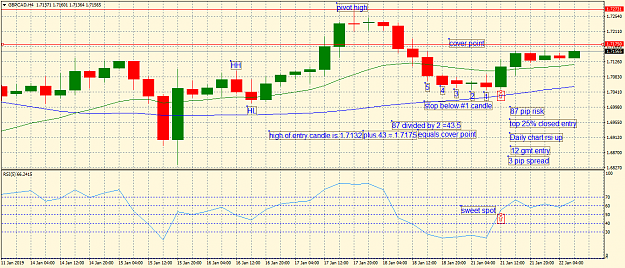
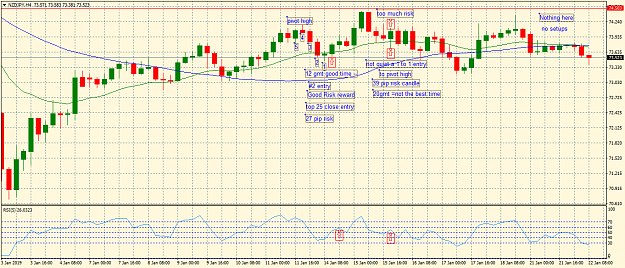
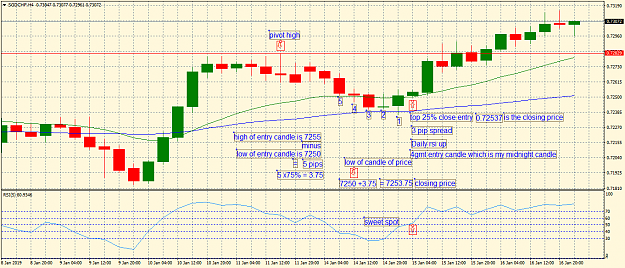
at these charts before you do anything else. I would even save this post or write it down. If you think you see a potential 25% close entry --- calculate one pip above that entry candle minus your stop loss and see what your pip distance is.....then look at your pivot high to left to see if you at least have that many pips too...which would be at least 1:1 ratio.You do this enough you can pretty much eye-ball it or do with the chart tool provided . I went into a little detail on this chart and hope it helps. To be honest i didn't see this trade which would have been a nice one.Remember the #2 entry right after the lowest low . Take care
at these charts before you do anything else. I would even save this post or write it down. If you think you see a potential 25% close entry --- calculate one pip above that entry candle minus your stop loss and see what your pip distance is.....then look at your pivot high to left to see if you at least have that many pips too...which would be at least 1:1 ratio.You do this enough you can pretty much eye-ball it or do with the chart tool provided . I went into a little detail on this chart and hope it helps. To be honest i didn't see this trade which would have been a nice one.Remember the #2 entry right after the lowest low . Take care
Attached Image (click to enlarge)
1