Found this useful indicator. 
You can use this for applying up to 8 charts at once and it will auto rotate through the pairs / timeframes.
The pairs and TF's can be edited. However, does anyone know how to make it display multiple timeframes on each slide instead?
IE - EURUSD (4 charts ) D1 / H4 / H1 / M15
Then GBPUSD (4 charts) D1 / H4 / H1 / M15
And so on..
Unfortunately I don't have the source for it.
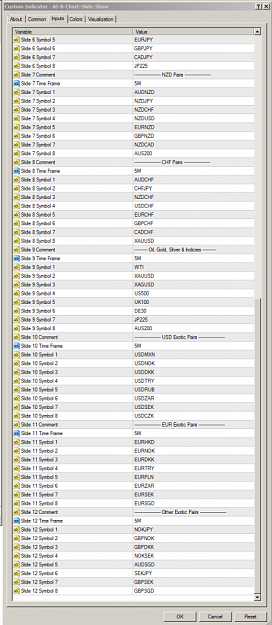
Attached Image (click to enlarge)
Attached File(s)
