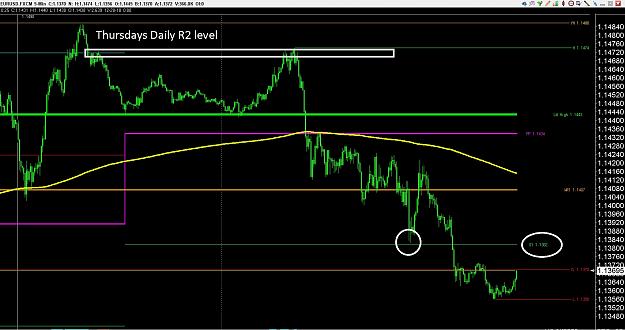
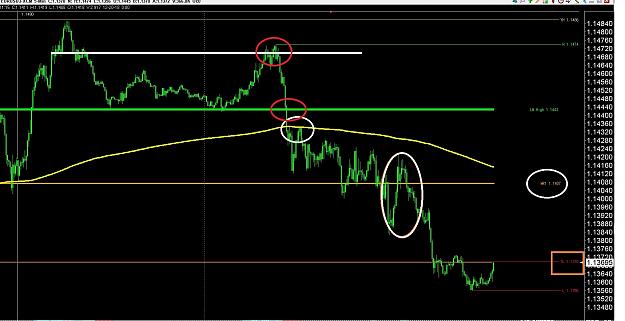
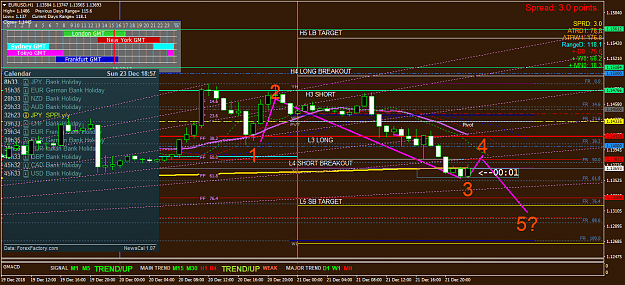
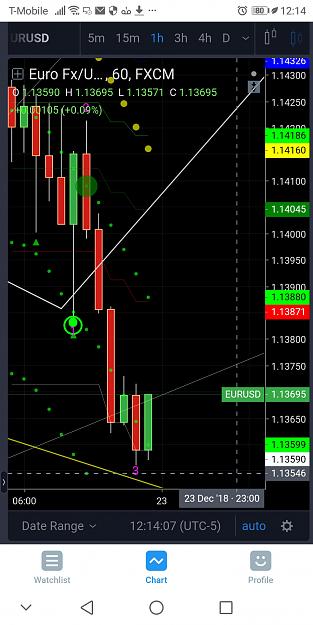
The things on your chart havent changed ,, I do believe you are trying to catch the bigger weekly swings as most are ,,,,,if your honest with yourself ,,the daily levels the daily pivot the daily S and R1 ones the 2s etc etc ,, get that shit off your charts ,, your taking scalp entries to hold for longer,,,long run it will be hard to change the being the come back kid but always losing most of it or worse losing more than you started with ,,, The daily levels for the most part will have you seeing things that arent there
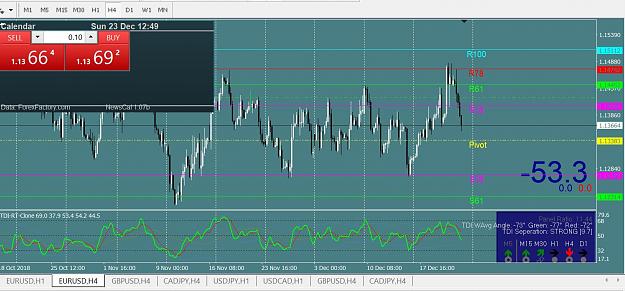
As stated before ,, the dxy charts you post with the same things on them translates to being wrong on 2 different instruments ,,nothing more ,,nothing less . The time frames you post all the standard time frames right down to a M1,,, ah the m1 the ole standard smallest increment of a day ,, one unit out of 1440 of the same units equals what has been standardized as one day ,,,hold that thought lol
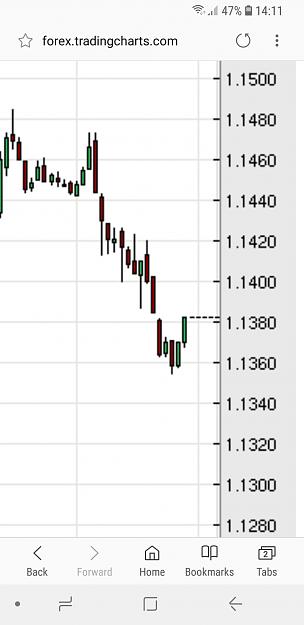
Ata is a big proponent of the simple hourly chart,,its a classic no doubt ,,used by many watched by many ,,can get many good patterns from it,,, the flags ,, the gartlys the butterflys that come to fruition time after time. Same as an M1 chart trading one day
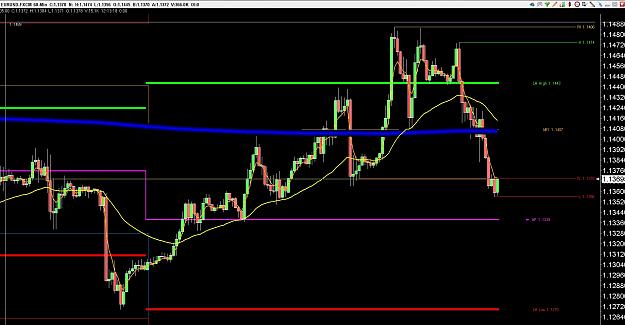
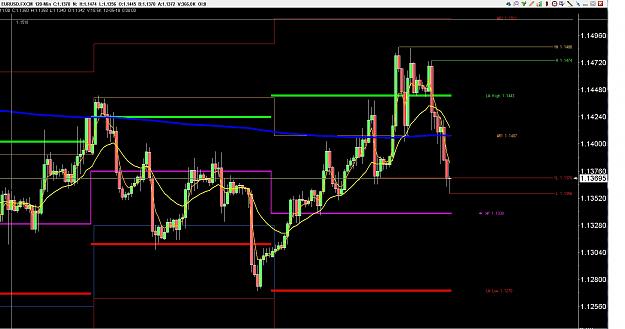
Here is where some of the disconnect may lie for many ,,,,,, as an m1 is for one day 1 out of 1440,, 1440x 5 equals the work week 7200 minutes (standardized) version ,, if one applies the same principle to the hourly chart some things may be a bit clearer ,, Ive told you before it is a bit of past history mixed with the here and now ,,, a hourly is one of 1440 or one out of what transpires in a week ,, the experienced know even with out seeing it but ones with a little less experience seeing the mkt gyrate some times with a bit more history or twice the amount would make better decisions.Easier for most when they see 2 periods of something to make a better decision ,, I have said before I do believe most would do better starting out if they doubled the time frame they used ,,charts posted may show why I said that and also why I say the time frame has nothing to do with what level is being used by the mkt and Moty also why I told you just showing enough to support or convince you of your own narrative is not profitable in the long run ,,if the mkt proves you wrong get tf out,, small acct or big ,,, learn to use a stp
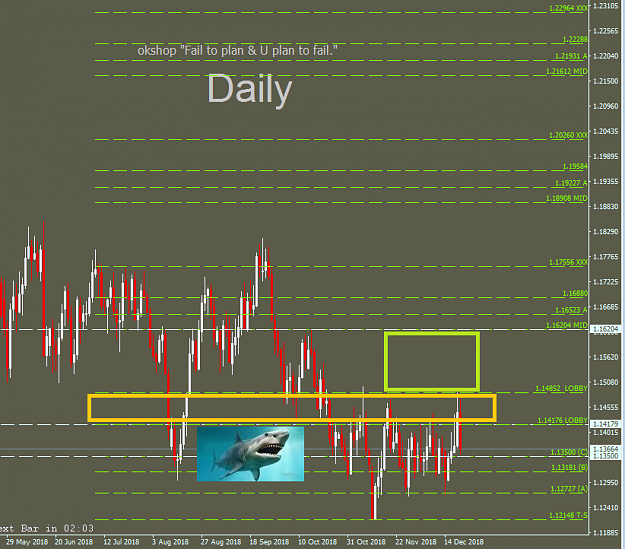
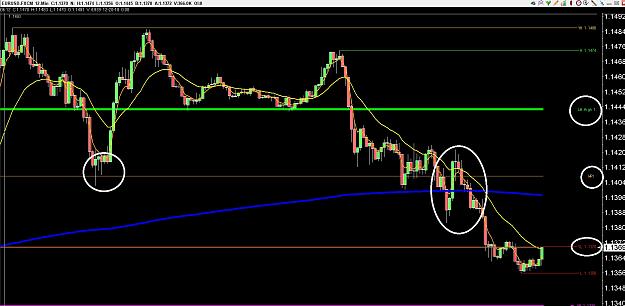
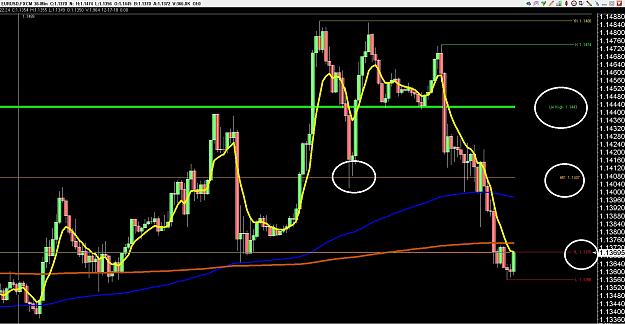
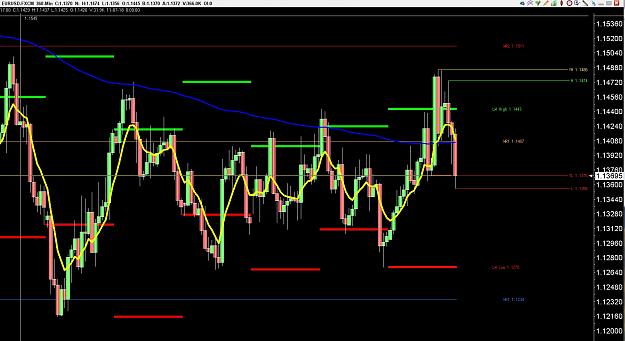
Charts posted ,,, H6,, H2 and the hourly ,,,,,,averages the same on all with the weekly levels ,,The standard pivots along with the weekly highs and lows ... ,,bout as simple as one can make it Moty ,, some times one can get used to all the shit they got on a chart and feel a bit naked if it isint there . If it isint helping you or worse hindering you,,take the plunge and get a little naked and dont buy highs and sell lows ,,in between roll with it dont fight it lol,, any rate ,,best of holiday wishes to you bud ,, dukes up man
Attached Image (click to enlarge)
Attached Image (click to enlarge)
Attached Image (click to enlarge)
8