• Home
  • Forums
  • Trades
  • News
  • Calendar
  • Market
  • Brokers
  • Login
  • Join
  • User/Email: Password:
  • 4:14pm
Menu
  • Forums
  • Trades
  • News
  • Calendar
  • Market
  • Brokers
  • Login
  • Join
  • 4:14pm
Sister Sites
  • Metals Mine
  • Energy EXCH
  • Crypto Craft

Options

Bookmark Thread

First Page First Unread Last Page Last Post

Print Thread

Similar Threads

Pairs Trading: Reversion to the Mean 22 replies

Mean Reversion TMA 7 replies

Forward test of my new mean reversion strategy 11 replies

Synthetic hedges, cointegration, mean reversion and similar stuff 419 replies

Cointegration, Synthetic hedges, mean reversion in R, Tech Thread 0 replies

  • Trading Systems
  • /
  • Reply to Thread
  • Subscribe
  • 232
Attachments: Simple Mean Reversion
Exit Attachments

Simple Mean Reversion

  • Last Post
  •  
  • 1 2223Page 242526 30
  • 1 23Page 2425 30
  •  
  • Post #461
  • Quote
  • Dec 12, 2018 1:42am Dec 12, 2018 1:42am
  •  AntiCre
  • Joined Jul 2015 | Status: Member | 477 Posts
@AO: Your proposition is that the overall market movement is constant. Right?
Now let's consider a triangulated market with just 3 currencies A, B, and C. Then M(A) + M(B) + M(C) = const for 1 time unit (where M(X) is the sum of all movements of the currency X). Is this what you are saying or do I misinterpret/misunderstand your point?

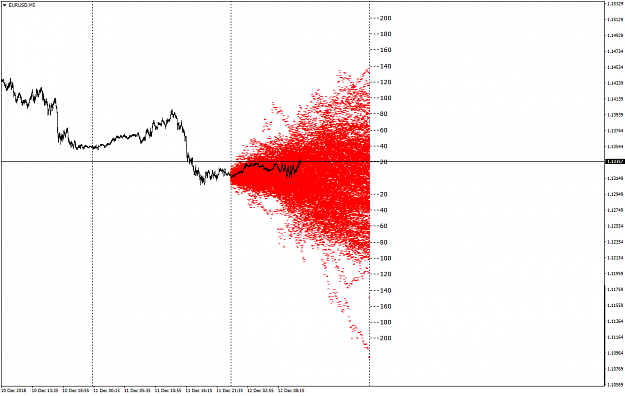
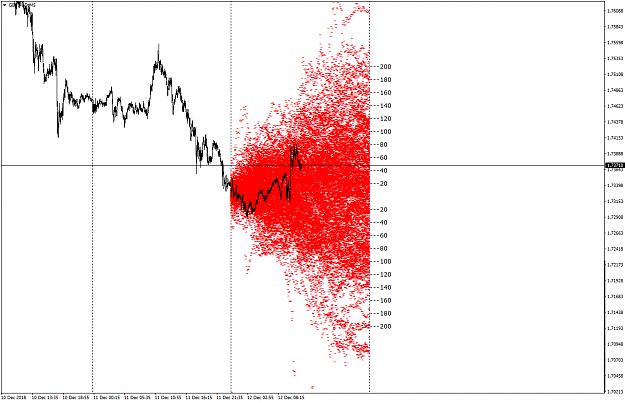
I've thought that whenever the currency pair AB moves strongly, AB, AC, and thus BC have to react (move) strongly, too.
CrucialPoint: "I'm alpha". AntiCre: "I'm your Omega - the end."
 
 
  • Post #462
  • Quote
  • Dec 12, 2018 4:54am Dec 12, 2018 4:54am
  •  PipMeUp
  • Joined Aug 2011 | Status: Member | 1,305 Posts
Don't worry AO I perfectly understood where you were getting at ;-)

When I realized the length of this coastline path was so long compared to the bird flight straight line I said to myself: "Oh F*** I want to be a market maker".

But your question was about the relationship between this length and trend vs range. I expected to see something like "when the move is not so big while the path is already very long that's a range otherwise we avoid mean reversion". But the scatter plot doesn't show anything that clear cut. The path can be both very long or quite short for the same return. Sure when there is a very very long path (>75000) the move is less than 200 pips but we can also see a 600 pip move with "only" 30000 "linear pips" (I don't know what to call that unit).

If the price walks so long to go nowhere then necessarily ticks go up and down is a fairly well balanced way. If this is true at any scale (aka power law) it's not moving in zig-zag but much more randomly to form the fractal. How to capture even a fraction of that? The first obvious way is to grid. I mean at every pip. First problem: we pay the spread we don't pocket it. Anyway. In theory we should capture a big share of the length (linear in volatility). But we would also lose quadratically in the return. An average day is 58 pips return and 18980 linear pips. Let's say the grid catches'em all. If there was no spread/no comm. we would win 18980 pips thanks to the grid and only lose 1711 pips because of the move. Days with big return and short length will be much less fun. Say 500 return and 25000 linear. We get 25000 - 500*501/2 = -100250... That's 10K lost in a day using micro lots. Again: no spread/no comm. And that's the kind of day that echo across all the board.
No greed. No fear. Just maths.
 
5
  • Post #463
  • Quote
  • Dec 12, 2018 4:56am Dec 12, 2018 4:56am
  •  DavidRP
  • Joined May 2008 | Status: Member | 456 Posts
Quoting PipMeUp
Disliked
Don't worry AO I perfectly understood where you were getting at ;-) When I realized the length of this coastline path was so long compared to the bird flight straight line I said to myself: "Oh F*** I want to be a market maker". But your question was about the relationship between this length and trend vs range. I expected to see something like "when the move is not so big while the path is already very long that's a range otherwise we avoid mean reversion". But the scatter plot doesn't show anything that clear cut. The path can be both very long...
Ignored
Perfectly explained. Thanks
 
 
  • Post #464
  • Quote
  • Dec 12, 2018 5:28am Dec 12, 2018 5:28am
  •  alphaomega
  • Joined Aug 2010 | Status: Stare Into the Lights My Pretties! | 752 Posts
Quoting PipMeUp
Disliked
Don't worry AO I perfectly understood where you were getting at ;-) When I realized the length of this coastline path was so long compared to the bird flight straight line I said to myself: "Oh F*** I want to be a market maker". But your question was about the relationship between this length and trend vs range. I expected to see something like "when the move is not so big while the path is already very long that's a range otherwise we avoid mean reversion". But the scatter plot doesn't show anything that clear cut. The path can be both very long...
Ignored
Yes the grid is the tool. But not the operator! You need automated central control unit to manage these grids for 28 pairs.
The control unit starts the gird at the right time, and stops at the right time. Otherwise the whole thing blows up on a regular basis. On average every 10-15 days the machine breaks. I suspect that the market makers initiate the "break switch" on pseudorandom intervals in order to prevent HFT machines like mine.

BTW Look at the difference between these 2 charts. EURUSD vs GBPAUD What is the first thing you notice?

Attached Image (click to enlarge)
Click to Enlarge

Name: EURUSDM5 1.png
Size: 43 KB

Attached Image (click to enlarge)
Click to Enlarge

Name: GBPAUDM5 1.png
Size: 63 KB
 
 
  • Post #465
  • Quote
  • Dec 12, 2018 5:31am Dec 12, 2018 5:31am
  •  DavidRP
  • Joined May 2008 | Status: Member | 456 Posts
Quoting alphaomega
Disliked
{quote} Yes the grid is the tool. But not the operator! You need automated central control unit to manage these grids for 28 pairs. The control unit starts the gird at the right time, and stops at the right time. Otherwise the whole thing blows up on a regular basis. On average every 10-15 days the machine breaks. I suspect that the market makers initiate the "break switch" on pseudorandom intervals in order to prevent HFT machines like mine. BTW Look at the difference between these 2 charts. EURUSD vs GBPAUD What is the first thing you notice?...
Ignored
volatility, much higher with GA
 
 
  • Post #466
  • Quote
  • Dec 12, 2018 9:54am Dec 12, 2018 9:54am
  •  PipMeUp
  • Joined Aug 2011 | Status: Member | 1,305 Posts
I'm not sure that the volatilities are very different. I think the larger fan out is an effect of scaling the chart vertically.
What I see is that E/U and G/A charts are looking alike. When you long one you short the other?
No greed. No fear. Just maths.
 
1
  • Post #467
  • Quote
  • Edited at 10:52am Dec 12, 2018 10:42am | Edited at 10:52am
  •  alphaomega
  • Joined Aug 2010 | Status: Stare Into the Lights My Pretties! | 752 Posts
Quoting PipMeUp
Disliked
I'm not sure that the volatilities are very different. I think the larger fan out is an effect of scaling the chart vertically. What I see is that E/U and G/A charts are looking alike. When you long one you short the other?
Ignored
For the most part the volatility is proportional to the price. The pairs with low absolute price have the lowest volatility. Or at least the averages are very close.

I pointed these 2 pairs specifically because from the whole pack of 28 these 2 are the 2 most "different" pairs! GBPNZD has almost identical properties to GBPAUD.
All other pairs are placed in the middle between these 2.

EURUSD has the most condensed cluster and GBPAUD has the most scattered. But in reality the difference is very small.
If we leave the absolute range aside, the other characteristics are very similar for all pairs.

What this means is that universal strategies exist. And these strategies can be optimized in such way that they can work equally well on all pairs!
Something like the search for the common denominator!?

At the same time, the pairs move in different directions at least 90% of the time (they have different PA shape) and this creates the effect which is necessary for the dynamic hedging model to work.

If you constantly buy at the current lowest prices and sell at the current highest prices on all pairs, the equity curve becomes very stable. Often you can have huge exposure with many positions going against you, but the net PL simply fluctuates around 0.

And so, if you take partial profits at fixed intervals you basically capture some percentage of the excess movement (randomly) while your equity stays flat.
It's pretty much risk free profit.

The bad news it that this model does not work all of the time! Occasionally (on average every 10-15 days) something in the market breaks and the balance in the equity disappears.
In the worst case scenario you can end up with 7 really bad positions. And somehow the combined loss from these positions almost exactly equals the net profit accumulated during the stable period.
Zero sum game??
 
4
  • Post #468
  • Quote
  • Dec 12, 2018 11:12am Dec 12, 2018 11:12am
  •  alphaomega
  • Joined Aug 2010 | Status: Stare Into the Lights My Pretties! | 752 Posts
The conclusion so far is that mean reversion is almost inescapable (Like gravity) and this affect everything, including your equity which also occasionally reverts to the mean.

So in order to beat the gravity, you have to (a)apply brute force or (b)find anti gravity technology. Both of these tasks are extremely difficult!
 
2
  • Post #469
  • Quote
  • Dec 12, 2018 11:29am Dec 12, 2018 11:29am
  •  VEEFX
  • Joined Jun 2006 | Status: Adios! | 3,377 Posts
Quoting alphaomega
Disliked
The conclusion so far is that mean reversion is almost inescapable (Like gravity) and this affect everything, including your equity which also occasionally reverts to the mean. So in order to beat the gravity, you have to (a)apply brute force or (b)find anti gravity technology. Both of these tasks are extremely difficult!
Ignored
Spot on brother. I would be very curious to see your results if you only flip the direction i.e leave everything as is and go fir divergence from mean. Try it man. you will learn a whole lot more about this superficial fiat market. The outcome would remain the same but it will give you more avenues to avoid "gravity"
Staying in my lane...
 
1
  • Post #470
  • Quote
  • Dec 13, 2018 10:23am Dec 13, 2018 10:23am
  •  VEEFX
  • Joined Jun 2006 | Status: Adios! | 3,377 Posts
Quoting alphaomega
Disliked
{quote} For the most part the volatility is proportional to the price. The pairs with low absolute price have the lowest volatility. Or at least the averages are very close. I pointed these 2 pairs specifically because from the whole pack of 28 these 2 are the 2 most "different" pairs! GBPNZD has almost identical properties to GBPAUD. All other pairs are placed in the middle between these 2. EURUSD has the most condensed cluster and GBPAUD has the most scattered. But in reality the difference is very small. If we leave the absolute range aside,...
Ignored
It is so amazing to see you are arriving at similar observations. Universal entries is the absolute necessary ingredient for any such balancing model to work imo. In the ocean of variablilities of every tick having the immense power to impact many pairs within the mathematically correlated currency model, one has to become the constant in actions and entries (and even exits but I found hard to do for both entries and exist so chose the universal entry route).

What I also discovered is entry "setup" (the how!) does not matter
1) directional bias is maintained throughout the week (or day)
2) Divergence or Reversion is maintained throughout the week(or day)
3) Trading frequency "spacing" is maintained within the given scale across the span of extremities across entries and exits. By this, I mean the speed of entries somehow has to be in balance with the speed of exits (I am not talking HFT here). Price has to be removed from this aspect (atleast I did and it worked great if you know when to Idle and when to go full on throttle!)

Once you track of EACH entry scale and manipulate the frequency (via TIME), you have a pretty decent tool at your disposal to remain "anti-gravitational" most of the time. It's that <5% of situations that I could not figure out which takes the account (VERY quickly and rapidly) to negative expectancy which I believe you are also observing in your model. I have repeatedly mentioned throughout the year that my universal time action model has one or two such conditions that I am just unable to analyze the root cause. SOMETHING mysterious just happens out there (and I truly believe it HAS to be done arithmetically/algorithmically) that PREVENTS such balance to be achieved 100% of the time and I also think this is in place BY DESIGN to prevent any non-US economy to have an unfair advantage over the rest of the world. Without the availability of this feature (I call "intrinsic manipulation"), we would be seeing a whole lot of more Central Bank interventions imo.

At the end, I just got burnt out, given my limited math skills and lack of fancy tools required to investigate further.
Staying in my lane...
 
1
  • Post #471
  • Quote
  • Dec 13, 2018 1:35pm Dec 13, 2018 1:35pm
  •  Cerugo
  • | Joined May 2012 | Status: Member | 51 Posts
Quoting VEEFX
Disliked
{quote} Good Job bro... something I have been screaming all long since I wore my "facts and data" hat. Many will NEVER understand the entire inner workings of that fantastic mathematical balance. It is REQUIRED to keep the faith in our global financial system. You are getting there.... on the right path but not possible in retail market structure with the tools we have available to us.... and mind you, in regulated markets, whatever you discover (I know where you are going with this) is not allowed under the context of "keeping markets fair and...
Ignored
I understang what you are talking about and agree with your principles. Your robot is a way to play the game. I have been testing it and the results are possitive. There are many " I would like" but I like this system. Please put the number of entries in the setup. Thank you for sharing this robot and your great ideas
 
 
  • Post #472
  • Quote
  • Dec 15, 2018 12:08pm Dec 15, 2018 12:08pm
  •  Justhappy
  • | Joined Dec 2018 | Status: Junior Member | 1 Post
Quoting alphaomega
Disliked
Initial testing from Jan 1, 2018, standard rules, without optimization: {image} {file}
Ignored
it is possible to enter the maximum lot number in ea?


is the mql file available?
 
 
  • Post #473
  • Quote
  • Dec 25, 2018 1:20pm Dec 25, 2018 1:20pm
  •  newhope
  • | Joined Mar 2018 | Status: Member | 86 Posts
Quoting alphaomega
Disliked
{quote} Yes the grid is the tool. But not the operator! You need automated central control unit to manage these grids for 28 pairs. The control unit starts the gird at the right time, and stops at the right time. Otherwise the whole thing blows up on a regular basis. On average every 10-15 days the machine breaks. I suspect that the market makers initiate the "break switch" on pseudorandom intervals in order to prevent HFT machines like mine. BTW Look at the difference between these 2 charts. EURUSD vs GBPAUD What is the first thing you notice?...
Ignored
Great images and explanation AO ... still have limited Time to read all of your great posts, especially the Cycle & Sqrt ... but will do it again soon after doing my homework , i hope ...
Time to wish you & all our good friends : a Merry Christmas 2018 & Happy New Year 2019 !! may we all get much green pips in this coming year ... i hope it is not too late to congratulate, isn't it ??
 
 
  • Post #474
  • Quote
  • Dec 26, 2018 4:17am Dec 26, 2018 4:17am
  •  Viking Nash
  • | Joined Mar 2012 | Status: Member | 26 Posts
Thank you Jagg for providing us the great indicator DRS_v1.2j. It works nice for past few months. But just after Christmas, I find all the band lines of the indicator in a little bit of chaos once the market reopen on 8:00 today. I guess it is due to the omission of hourly records before 8:00.

Is there anyway to fix it?


Merry Christmas and Happy New Year to all!
Attached Image
 
 
  • Post #475
  • Quote
  • Dec 26, 2018 6:16pm Dec 26, 2018 6:16pm
  •  littspaniard
  • Joined Mar 2011 | Status: moving | 3,641 Posts
Quoting Jagg
Disliked
{quote} Nice! But I think posting numerous individual trade entries/exits doesn't make really sense here in the thread. Or should I post screenshots of all the ~200 trade entries and ~200 trade exits my EA is doing over the week (The thread gets messy by doing that imho) To bring some value to my post here I show the trades taken by the EA for the best performing instrument last week - which was the DAX index (#9993 original method). {image}
Ignored
Hi Jagg
I am in love with everything that smells like dax and in relation to the graphics that you post I have been looking at the image and sometimes it seems that you enter not only in the ATR lines but also among them, I understand with the sequence 1,1,1 , 2,2,2,3. I would like to ask you why those entries between the ATR lines.
It would also be interesting to see how the robot behaves, being able to establish the departure of the ATR bands starting a one hours before the opening of Frankfurt. If you ever have time and try it, please tell us the results.
I hope that one day you will be encouraged to publish the EA but I understand perfectly why not publish it.
In any case, very interesting thread in relation with Normal or Gaussian distribution among other concepts.
Regards.
The only constant is change
 
 
  • Post #476
  • Quote
  • Dec 27, 2018 1:36am Dec 27, 2018 1:36am
  •  Viking Nash
  • | Joined Mar 2012 | Status: Member | 26 Posts
Quoting Viking Nash
Disliked
Thank you Jagg for providing us the great indicator DRS_v1.2j. It works nice for past few months. But just after Christmas, I find all the band lines of the indicator in a little bit of chaos once the market reopen on 8:00 today. I guess it is due to the omission of hourly records before 8:00. Is there anyway to fix it? Merry Christmas and Happy New Year to all! {image}
Ignored

Today it is back to normal.
 
2
  • Post #477
  • Quote
  • Dec 27, 2018 7:40am Dec 27, 2018 7:40am
  •  Jagg
  • Joined Oct 2006 | Status: Member | 519 Posts
Quoting littspaniard
Disliked
{quote} Hi Jagg I am in love with everything that smells like dax and in relation to the graphics that you post I have been looking at the image and sometimes it seems that you enter not only in the ATR lines but also among them, I understand with the sequence 1,1,1 , 2,2,2,3. I would like to ask you why those entries between the ATR lines. It would also be interesting to see how the robot behaves, being able to establish the departure of the ATR bands starting a one hours before the opening of Frankfurt. If you ever have time and try it, please...
Ignored
The EA takes the first entry only when we reach ATR band x (and I use e.g. ATR band 6 as a "chaos stop loss" to get out of all positions and don't do further buys/sells). All trades after that 1st one have nothing to do with the ATR bands, see post 1
Quote
Disliked
2. Secondary signal. (Position build-up).
If the current price is above the previous entry price + X.....
 
 
  • Post #478
  • Quote
  • Jan 4, 2019 11:36pm Jan 4, 2019 11:36pm
  •  VEEFX
  • Joined Jun 2006 | Status: Adios! | 3,377 Posts
Quoting Cerugo
Disliked
{quote} I understang what you are talking about and agree with your principles. Your robot is a way to play the game. I have been testing it and the results are possitive. There are many " I would like" but I like this system. Please put the number of entries in the setup. Thank you for sharing this robot and your great ideas
Ignored
hmm.. I have not shared my robot with anyone.... just thoughts, ideas, techniques, philosophies, and snippets of code.... but appreciate the feedback :-)

Perhaps one day I will share the whole enchilada but not until I give it one more attempt down the road (outside of CrapT4) when I have free time and when I gain some machine/deep learning skills.
Staying in my lane...
1
 
  • Post #479
  • Quote
  • Jan 5, 2019 1:46pm Jan 5, 2019 1:46pm
  •  libra_reserv
  • Joined Feb 2013 | Status: Member | 69 Posts
Quoting traderefx
Disliked
{image}
Ignored
Great,
Mr. Traderefx would you please share here the trend confirmation indicator which is (in blue and red) in the picture. Many thanks
Watch market as a layman, Do have a opposit trade what ur mind suggest ;-)
 
 
  • Post #480
  • Quote
  • Jan 6, 2019 12:49am Jan 6, 2019 12:49am
  •  libra_reserv
  • Joined Feb 2013 | Status: Member | 69 Posts
Quoting leppozdrav
Disliked
{quote} You are right. DD almost equals the final return. Increasing the account size is ok and would lower the DD, but it's just a bandage for the strategy or "escaping the problem" in this case. I would focus more on filtering those bad spikes and close them sooner - limit the opening of new orders. So, Alphaomega suggested to play out this strategy on uncorrelated Fx pairs. I don't say, we should just put it on a net of baskets and let it run. Choosing the right Fx pairs is one of the keys here for this to go better. So I did that. Below is a...
Ignored
Would be great if you can please share the setting you used for the subject test.
Watch market as a layman, Do have a opposit trade what ur mind suggest ;-)
 
 
  • Trading Systems
  • /
  • Simple Mean Reversion
  • Reply to Thread
    • 1 2223Page 242526 30
    • 1 23Page 2425 30
0 traders viewing now
  • More
Top of Page
Forex Factory Blog Updated: Alerting All Members
  • Facebook
  • Twitter
About FF
  • Mission
  • Products
  • User Guide
  • Media Kit
  • Blog
  • Contact
FF Products
  • Forums
  • Trades
  • Calendar
  • News
  • Market
  • Brokers
  • Trade Explorer
FF Website
  • Homepage
  • Search
  • Members
  • Report a Bug
Follow FF
  • Facebook
  • Twitter

FF Sister Sites:

  • Metals Mine
  • Energy EXCH
  • Crypto Craft

Forex Factory® is a brand of Fair Economy, Inc.

Terms of Service / ©2022