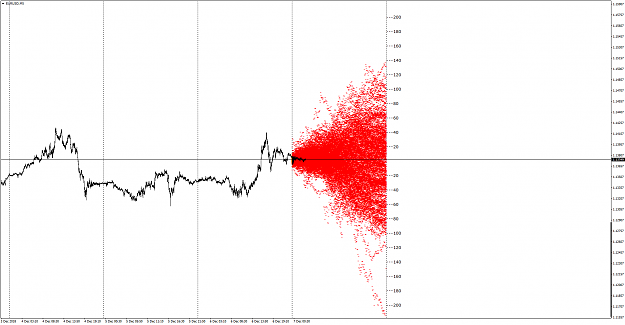
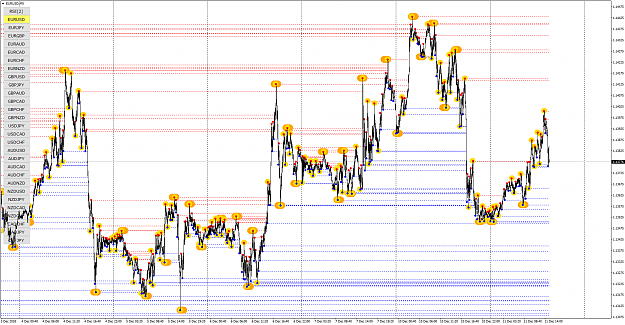
• Home
  • Forums
  • Trades
  • News
  • Calendar
  • Market
  • Brokers
  • Login
  • Join
  • User/Email: Password:
  • 10:30am
Menu
  • Forums
  • Trades
  • News
  • Calendar
  • Market
  • Brokers
  • Login
  • Join
  • 10:30am
Sister Sites
  • Metals Mine
  • Energy EXCH
  • Crypto Craft

Options

Bookmark Thread

First Page First Unread Last Page Last Post

Print Thread

Similar Threads

Pairs Trading: Reversion to the Mean 22 replies

Mean Reversion TMA 7 replies

Forward test of my new mean reversion strategy 11 replies

Synthetic hedges, cointegration, mean reversion and similar stuff 419 replies

Cointegration, Synthetic hedges, mean reversion in R, Tech Thread 0 replies

  • Trading Systems
  • /
  • Reply to Thread
  • Subscribe
  • 233
Attachments: Simple Mean Reversion
Exit Attachments
Tags: Simple Mean Reversion
Cancel

Simple Mean Reversion

  • Last Post
  •  
  • 1 2021Page 222324 30
  • 1 21Page 2223 30
  •  
  • Post #421
  • Quote
  • Dec 1, 2018 3:01am Dec 1, 2018 3:01am
  •  VEEFX
  • Joined Jun 2006 | Status: Adios! | 3,377 Posts
Quoting alphaomega
Disliked
{quote} Yes, I'm pretty sure. What you see on the chart is a stress test with maximum leverage 500:1 ! And the system still survives. This means that with lower leverage this system is very safe.
Ignored
Just sharing my experience... I spent months developing and optimizing a multi-strategy, multi-pair, multi-tf system on 500:1 leverage using offshore broker which was extremely profitable (by design) only during fat tails (diversified divergence from mean instead of reversion to mean). When I moved to 50 leverage, it balked because it limits the scope of diversification and the way I calculate my position sizing based on FreeMargin. What you said is true only if you have a very large capital base to compensate for the leverage and have no impact on diversification across the intended multiple pairs of choosing. Just sharing my own experience which turned out to be quite disappointing in the end. I would also say (not sure if this is applicable in your design).... I would question the merit of long term success of any strategy that is dependent or sensitive to Account Balance or Account Leverage or Position Sizing in general. To me, these are the tell tale signs of a heavily optimized strategy to curve-fit the market movements from past.
I really hope you have found the gold brother. I never doubted your intelligence :-)
Staying in my lane...
 
2
  • Post #422
  • Quote
  • Dec 1, 2018 10:09am Dec 1, 2018 10:09am
  •  Masterrmind
  • Joined Jun 2013 | Status: Master chaos and you master trading | 11,257 Posts
Quoting alphaomega
Disliked
{quote} Yes, I'm pretty sure. What you see on the chart is a stress test with maximum leverage 500:1 ! And the system still survives. This means that with lower leverage this system is very safe.
Ignored
Certainly the rest of the trade analytics would be useful here instead of just showing a single chart.

But its your show.

Masterrmind.............
Master your Mind then Master your Trades
 
1
  • Post #423
  • Quote
  • Dec 1, 2018 10:30am Dec 1, 2018 10:30am
  •  simjo
  • Joined Mar 2017 | Status: to reach unreachable star | 269 Posts
Quoting alphaomega
Disliked
THINK! PATTERNS! MARKET MODELS! TOTAL NUMBER OF VARIATIONS??? CYCLES! TIME DIVIDERS! RELATIONSHIPS BETWEEN TIME AND PRICE! PRICE OVER TIME! PRICE MOVING OVER TIME! (Not time over price!) TIME IS THE KEY! TIME DETERMINES PRICE! (Not the other way) NUMBER OF MARKET MODELS BASED ON FIXED TIME CYCLES? HOW MANY? 3 ! 1. HORIZONTAL RANGE (Many variations) 2. RANGE WITH DIRECTIONAL DRIFT (Many variations) 3. SMOOTH DIRECTIONAL TREND (Many variations) WHAT ARE THE PERCENTAGES FOR EACH MODEL TYPE? 1 - DOMINATES! 2 - APPEARS FROM TIME TO TIME. 3 - VERY RARE!...
Ignored
Secrete of No 6 is market conditions?

1 High volatility
2 Low volatility
3 Trending up
4 Trending down
5 Ranging
6 Transition condition

market made up on these conditions.
 
 
  • Post #424
  • Quote
  • Edited 12:56pm Dec 1, 2018 12:36pm | Edited 12:56pm
  •  zigler
  • | Joined Feb 2016 | Status: Member | 166 Posts
Quoting alphaomega
Disliked
"1, 2, 4, 5, 7, 8 1 * 1 = 1 2 * 2 = 4 4 * 4 = 16 1 + 6 = 7 5 * 5 = 25 2 + 5 = 7 7 * 7 = 49 4 + 9 = 13 1 + 3 = 4 8 * 8 = 64 6 + 4 = 10 1 + 0 = 1 1 * 2 * 4 * 5 * 7 * 8 = 2240 2 + 2 + 4 + 0 = 8 NO 3 6 9 ??? THINK OUTSIDE THE BOX! 1 + 4 + 7 + 7 + 4 + 1 = 24 2 + 4 = 6 1 + 4 + 16 + 25 + 49 + 64 = 159 1 + 5 + 9 = 15 1 + 5 = 6 6 + 6 = 12 1 + 2 = 3 6 * 6 = 36 3 + 6 = 9 3 6 9 HMMM! DOWN THE RABBIT HOLE....... NO TURNING BACK!
Ignored
Yeah, and all you actually need is:

1 - Buy, 0 - Sell (up/down, high/low). That be it...

Everything else is meaningless.. Sell high, buy low, zoom f*g out for better results, cause on 5min you really don't know
where you are... Kinda Photoshop trading, if it's high on screen sell, if its low, buy, do this on 30+ pairs and you got profit...
Simplify as possible, not otherwise...
 
 
  • Post #425
  • Quote
  • Dec 4, 2018 7:01am Dec 4, 2018 7:01am
  •  Jagg
  • Joined Oct 2006 | Status: Member | 533 Posts
Quoting Jagg
Disliked
I stopped posting the weekly results a few weeks ago.... For anyone interested here are the monthly results (and all time result from july until friday last week). More or less good profits were generated only for the indices CFD (Dax and Dow) - forex doesn't look that good. 9990 = my variant of SMR with 4H MA filter, BE stop, no fixed timed 25%/50% exits but "candlestick jumping stop loss" - see above for more details 9993 = original method from post 1 with only BE...
Ignored
Missed the all time results from magic number 9993 - so here is the last peace of my gathered results

(for better comparison again the all time results from magic number 9990)
Attached Image(s) (click to enlarge)
Click to Enlarge

Name: 2018-11-23 Results ALL TIME 2 - from July 2018 until November 20181123 Simple Mean Reversion EA .png
Size: 14 KB
Click to Enlarge

Name: 2018-11-23 Results ALL TIME - from July 2018 until November 20181123 Simple Mean Reversion EA 99.png
Size: 10 KB
 
1
  • Post #426
  • Quote
  • Dec 4, 2018 9:42pm Dec 4, 2018 9:42pm
  •  mav3n
  • | Joined Sep 2015 | Status: Member | 207 Posts
Quoting alphaomega
Disliked
...... Here you can test one of my new tools: Drawdown logger. {file} This indicator will log your account drawdown in real time with perfect accuracy! ............
Ignored
Dear Alpha,
Is it possible to have the drawdown for each pair opened? Thanks in advanced
 
 
  • Post #427
  • Quote
  • Dec 5, 2018 1:17am Dec 5, 2018 1:17am
  •  alphaomega
  • Joined Aug 2010 | Status: Stare Into the Lights My Pretties! | 762 Posts
Quoting mav3n
Disliked
{quote} Dear Alpha, Is it possible to have the drawdown for each pair opened? Thanks in advanced
Ignored
Yes, it's possible, but not with this indicator.
This indicator records the difference between the balance and equity taking into account all open positions. When you don't have open positions it does not record anything.
 
 
  • Post #428
  • Quote
  • Dec 5, 2018 1:39am Dec 5, 2018 1:39am
  •  mav3n
  • | Joined Sep 2015 | Status: Member | 207 Posts
Quoting alphaomega
Disliked
{quote} Yes, it's possible, but not with this indicator. This indicator records the difference between the balance and equity taking into account all open positions. When you don't have open positions it does not record anything.
Ignored
Dear Alpha, thanks for the quick reply, looking forward for the 'each pair drawdown' Indicator .

Thanks anyway for the info.
 
 
  • Post #429
  • Quote
  • Edited 12:47pm Dec 5, 2018 11:51am | Edited 12:47pm
  •  Chake
  • Joined Nov 2007 | Status: Long time member | 765 Posts
AO, with your DD logger i can see one version of this system i made, sometimes reaches 50% DD intraday... But always comes out ahead eventually.
How much intraday DD do you experience in your system if I may ask? And how much would you consider too much?
Persistence will get it. Consistency will keep it.
 
 
  • Post #430
  • Quote
  • Dec 5, 2018 12:13pm Dec 5, 2018 12:13pm
  •  alphaomega
  • Joined Aug 2010 | Status: Stare Into the Lights My Pretties! | 762 Posts
Quoting Chake
Disliked
AO, with your DD logger i can see one version of this system i made sometimes reaches 50% DD intraday... But always comes out ahead eventually. How much intraday DD do you experience in your system if I may ask? And how much would you consider too much?
Ignored
There is no such thing as too much drawdown on account basis. All depends on how you manage your capital and how much you are willing to lose.
All about risk:reward.

If You don't understand what I mean, you can check one of my old posts on this topic. This is how I manage my capital.
You can apply this system no matter how large or small your capital is.
 
1
  • Post #431
  • Quote
  • Dec 5, 2018 12:54pm Dec 5, 2018 12:54pm
  •  Chake
  • Joined Nov 2007 | Status: Long time member | 765 Posts
Quoting alphaomega
Disliked
{quote} There is no such thing as too much drawdown on account basis. All depends on how you manage your capital and how much you are willing to lose. All about risk:reward. If You don't understand what I mean, you can check one of my old posts on this topic. This is how I manage my capital. You can apply this system no matter how large or small your capital is.
Ignored
great post, thanks!
Persistence will get it. Consistency will keep it.
 
 
  • Post #432
  • Quote
  • Dec 6, 2018 8:35pm Dec 6, 2018 8:35pm
  •  alphaomega
  • Joined Aug 2010 | Status: Stare Into the Lights My Pretties! | 762 Posts
Do you want to know WHY this system works??
Here is the answer in the form of nicely visualized statistical data.
This is the price distribution (close prices on M5) from the last 200 days on EURUSD.
Do you notice the cluster in the first half of the day??
BOOM!

Attached Image (click to enlarge)
Click to Enlarge

Name: EURUSDM5.png
Size: 65 KB
 
6
  • Post #433
  • Quote
  • Dec 9, 2018 7:15am Dec 9, 2018 7:15am
  •  zerocash
  • | Joined Dec 2018 | Status: Junior Member | 1 Post
Do you do your statistical analysis in MT4?
Have you changed scale in/out or do you still add to losses on this EA?

Nice EA thanks for all your posts, not just this one.
 
1
  • Post #434
  • Quote
  • Dec 11, 2018 6:33am Dec 11, 2018 6:33am
  •  alphaomega
  • Joined Aug 2010 | Status: Stare Into the Lights My Pretties! | 762 Posts
Can you see the pattern?
Attached Image (click to enlarge)
Click to Enlarge

Name: The Secret Order.png
Size: 464 KB
 
2
  • Post #435
  • Quote
  • Dec 11, 2018 7:19am Dec 11, 2018 7:19am
  •  alphaomega
  • Joined Aug 2010 | Status: Stare Into the Lights My Pretties! | 762 Posts
If the market moves from point A to point B in a straight line over time T, then what is the actual length of the movement from A to B ?
If the market moves up from point A to point B and down from B to point C, then what is the actual length of the movement from A to C ?
If the market moves down from point A to point B and up from B to C and down from C to D, then what is the actual length of the movement from A to D?
If the market moves........

Yes, that's right. The more it moves, the longer the length becomes. Or in other words, the frequency of directional change + the amplitude determines the total length.

Now, here comes the real question!
Where the total length of price movement is longer? During range, or during trend? And why this even matters?
What happens when you know precisely the total length of price movement for all time frames and all markets all the time?
 
4
  • Post #436
  • Quote
  • Dec 11, 2018 7:59am Dec 11, 2018 7:59am
  •  DavidRP
  • Joined May 2008 | Status: Member | 456 Posts
Quoting alphaomega
Disliked
If the market moves from point A to point B in a straight line over time T, then what is the actual length of the movement from A to B ? If the market moves up from point A to point B and down from B to point C, then what is the actual length of the movement from A to C ? If the market moves down from point A to point B and up from B to C and down from C to D, then what is the actual length of the movement from A to D? If the market moves........ Yes, that's right. The more it moves, the longer the length becomes. Or in other words, the frequency...
Ignored
well I have more questions. How are A,B,C,D defined? Local max /mins?
 
 
  • Post #437
  • Quote
  • Dec 11, 2018 8:11am Dec 11, 2018 8:11am
  •  alphaomega
  • Joined Aug 2010 | Status: Stare Into the Lights My Pretties! | 762 Posts
Quoting DavidRP
Disliked
{quote} well I have more questions. How are A,B,C,D defined? Local max /mins?
Ignored
The best way is to use fractals from different time frames! I simply apply the standard formula with 5 bars. You can apply this formula even down to the tick level.

BTW Just look at the EURUSD for example. How much movement there is! The total length is enormous! Thousands and thousands of pips every week!

Attached Image (click to enlarge)
Click to Enlarge

Name: EURUSDM5 Fractals.png
Size: 132 KB
 
2
  • Post #438
  • Quote
  • Dec 11, 2018 9:45am Dec 11, 2018 9:45am
  •  AntiCre
  • Joined Jul 2015 | Status: Member | 482 Posts
Quoting alphaomega
Disliked
What happens when you know precisely the total length of price movement for all time frames and all markets all the time?
Ignored
Reminds me somehow on th π and river movement analogy. However, if you use the tick chart to get the best estimate of the market fluctuations, you'll find that π is very different from 3.141 ...

So, if we would precisly know the total length of price movements for a particular time and time frame, we could somehow predict how price has to act. Example: We know that price has to move X ticks within 1 hour. Now we waited 55 minutes but price just went X - 142 ticks. Thus, price has to move more (either in an oscillating = ranging or in a straight line manner) to reach X within the remaining 5 minutes ...?!
 
1
  • Post #439
  • Quote
  • Dec 11, 2018 11:18am Dec 11, 2018 11:18am
  •  DavidRP
  • Joined May 2008 | Status: Member | 456 Posts
Quoting AntiCre
Disliked
{quote} Reminds me somehow on th π and river movement analogy. However, if you use the tick chart to get the best estimate of the market fluctuations, you'll find that π is very different from 3.141 ... So, if we would precisly know the total length of price movements for a particular time and time frame, we could somehow predict how price has to act. Example: We know that price has to move X ticks within 1 hour. Now we waited 55 minutes but price just went X - 142 ticks. Thus, price...
Ignored
Yep that's fine but again, you need direction in order to profit from the move. At the start of the day I know a pair is going to move >60 pips, but I need direction to get the pips..
 
2
  • Post #440
  • Quote
  • Dec 11, 2018 11:49am Dec 11, 2018 11:49am
  •  AntiCre
  • Joined Jul 2015 | Status: Member | 482 Posts
Quoting DavidRP
Disliked
{quote} Yep that's fine but again, you need direction in order to profit from the move. At the start of the day I know a pair is going to move >60 pips, but I need direction to get the pips..
Ignored
Yes - I was never able to do something useful with it, especially since its variation is too high in short-term applications ...
 
2
  • Trading Systems
  • /
  • Simple Mean Reversion
  • Reply to Thread
    • 1 2021Page 222324 30
    • 1 21Page 2223 30
0 traders viewing now
  • More
Top of Page
  • Facebook
  • Twitter
About FF
  • Mission
  • Products
  • User Guide
  • Media Kit
  • Blog
  • Contact
FF Products
  • Forums
  • Trades
  • Calendar
  • News
  • Market
  • Brokers
  • Trade Explorer
FF Website
  • Homepage
  • Search
  • Members
  • Report a Bug
Follow FF
  • Facebook
  • Twitter

FF Sister Sites:

  • Metals Mine
  • Energy EXCH
  • Crypto Craft

Forex Factory® is a brand of Fair Economy, Inc.

Terms of Service / ©2023