Low volume test pattern trading.
Testing Supply:
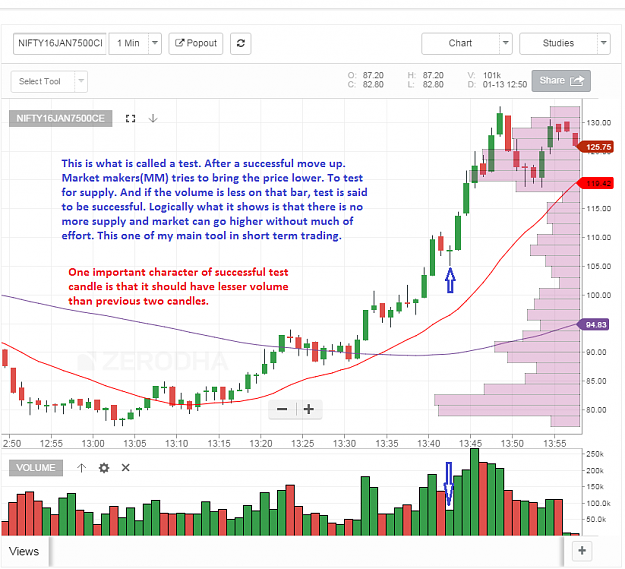
Testing is a low volume buy/sell signals. Will be discussing in context of long entries but same applicable for short signals as well. Rallies are short lived if there is supply in the background. Smart Money(SM) knows that the floating supply can be removed from the market. But they have to be sure that the supply has been completely removed before trying to trade up. The best way to find out this is to rapidly mark the prices down. This challenges any bears to come out. The amount of volume(activity) as the market is marked down will tell how much selling there is.
Low volume shows little selling on mark down. High volume shows that there is selling(supply) on the mark down. This process is called Testing. Testing is a good sign of market strength. But make sure that you have strength in background. This can be a stopping volume for eg. A successful test usually takes the market up immediately. Unsuccessful test usually results in a temporary up move and will be marked down sooner to re test.
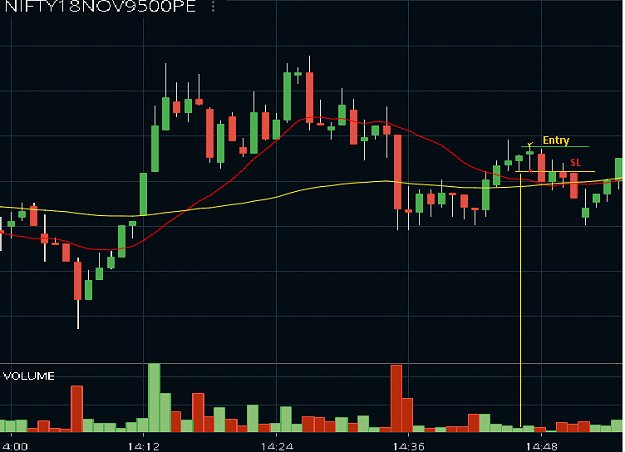
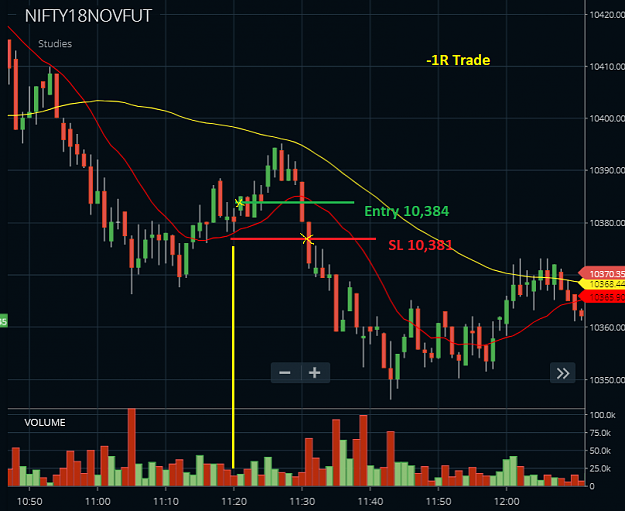
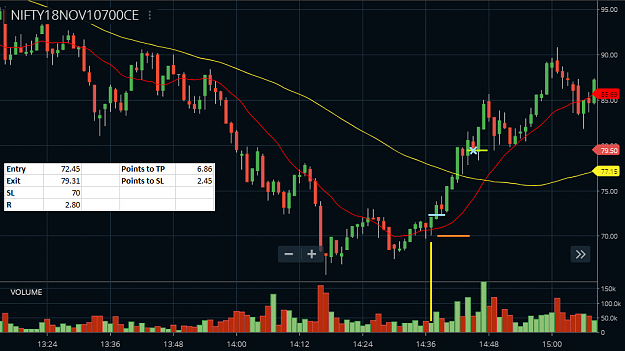
Example 1,
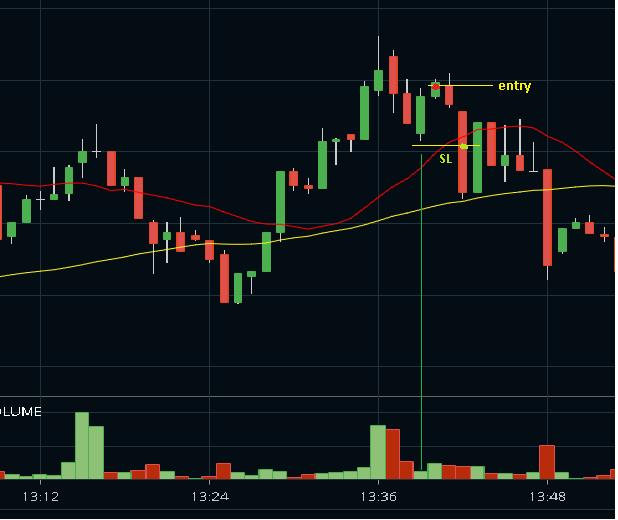
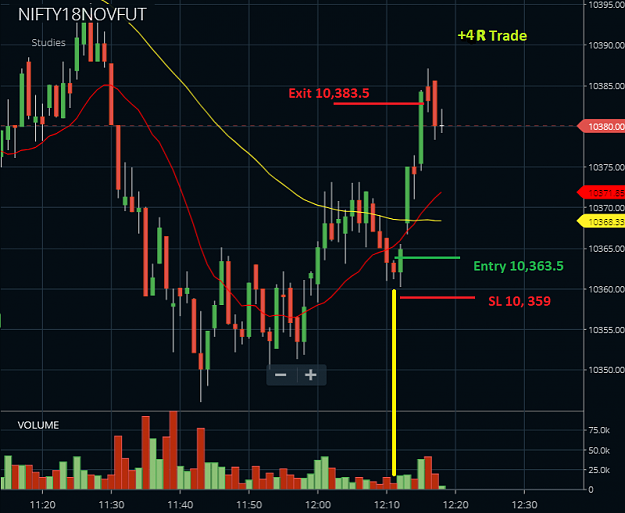
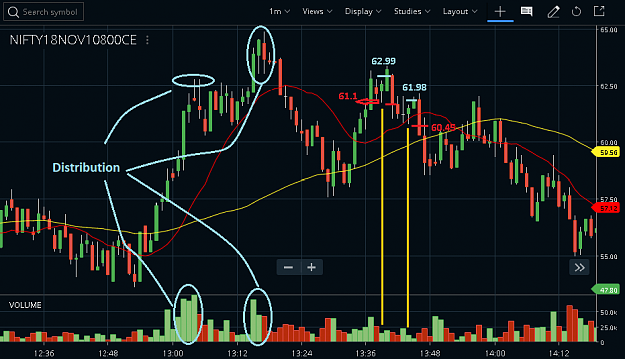
Example 2,
Example 3,
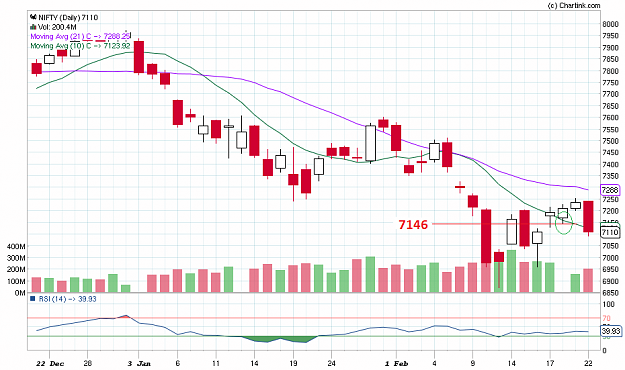
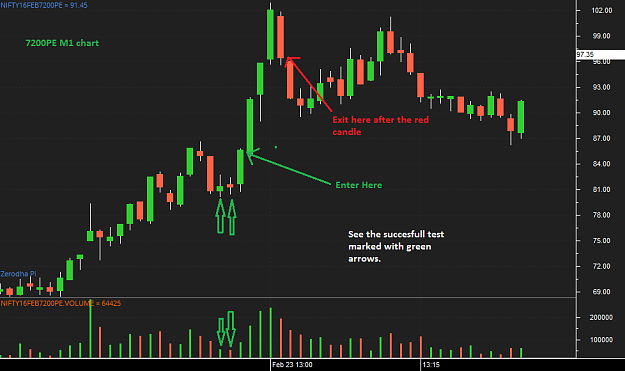
confluence of "rejection from nifty resistance line" and "test pattern on 7200PE option".
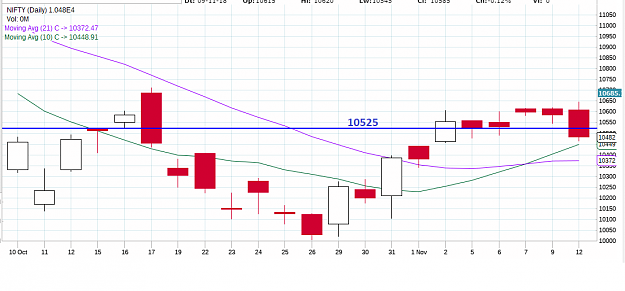
Below is the Nifty daily chart showing a resistance line on daily, the lowest point on 19th feb. ie 7146
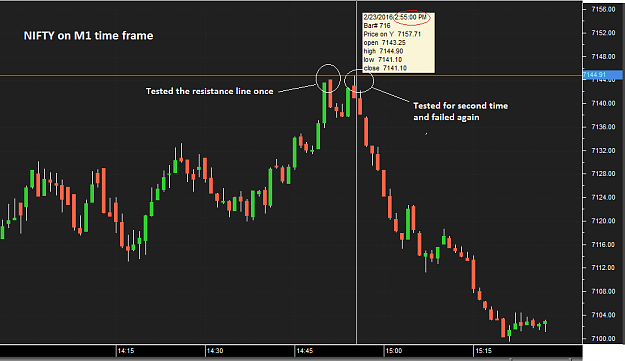
Now lets zoom inside to M1 time frame and see whats the price action around this area. Price tried to break through the resistance once, but failed. It tried again failed again with a nice bearish candle. Note the current candle time 2:55 PM which we will correlate with the option chart.
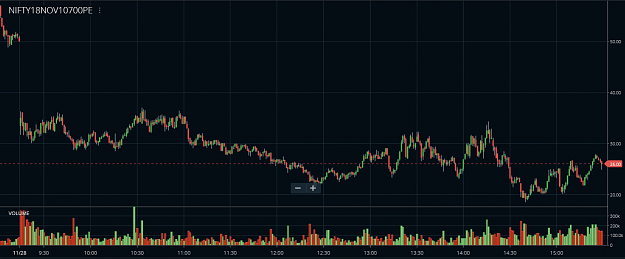
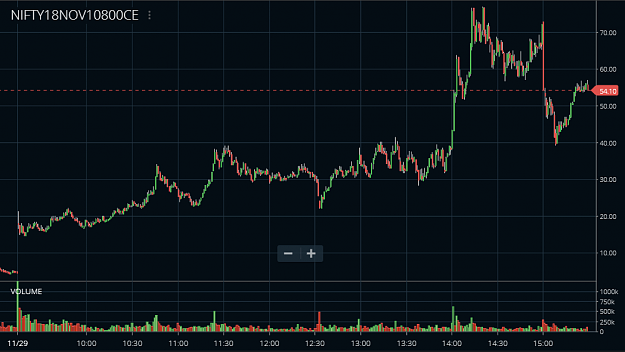
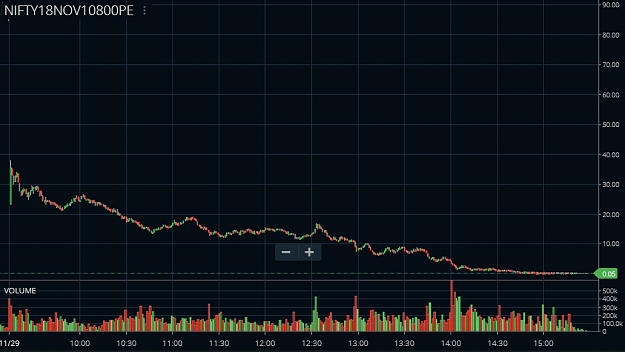
Below chart is the NIFTY7200PE options chart. Here you can see the test pattern.
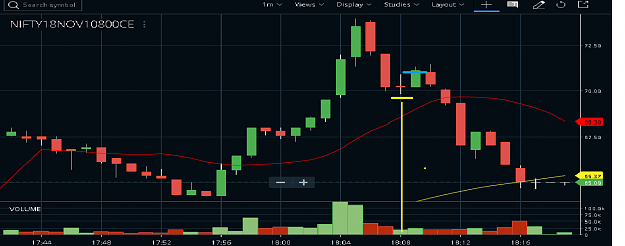
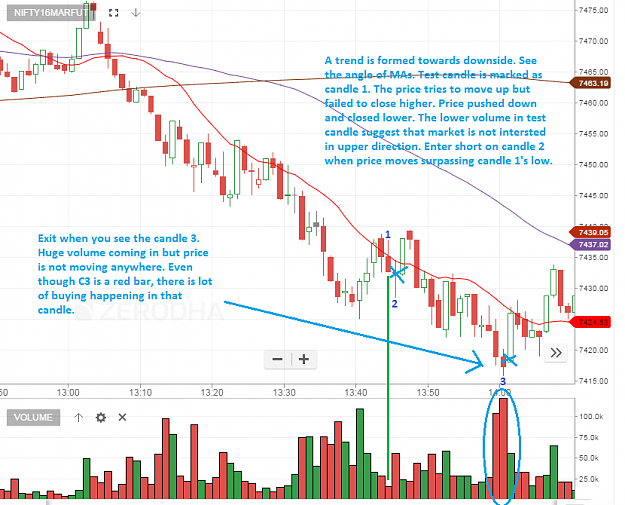
Example 4,
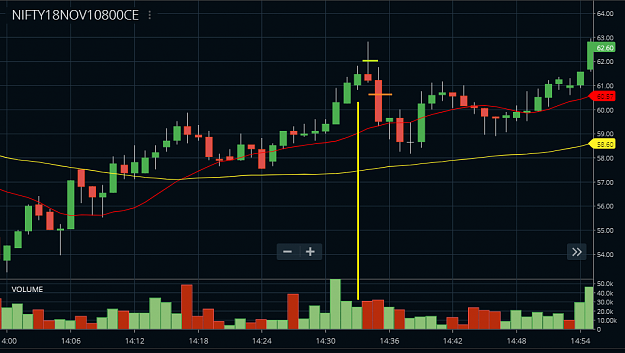
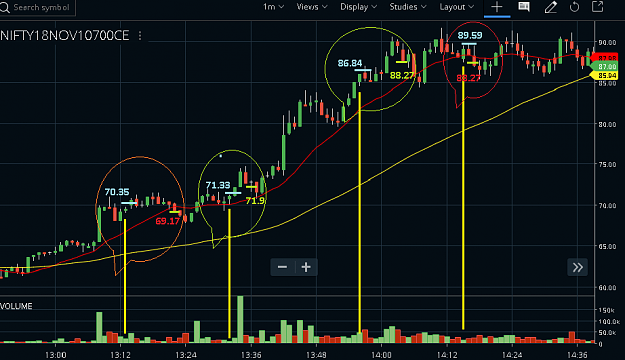
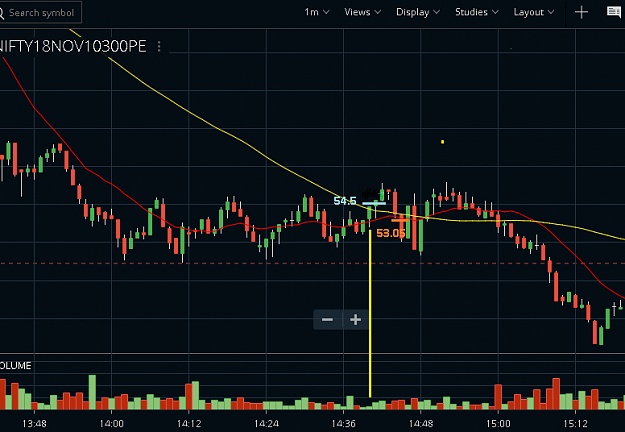
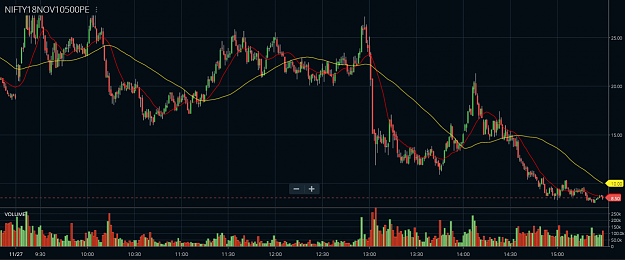
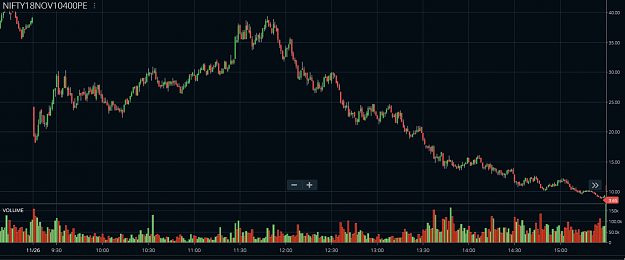
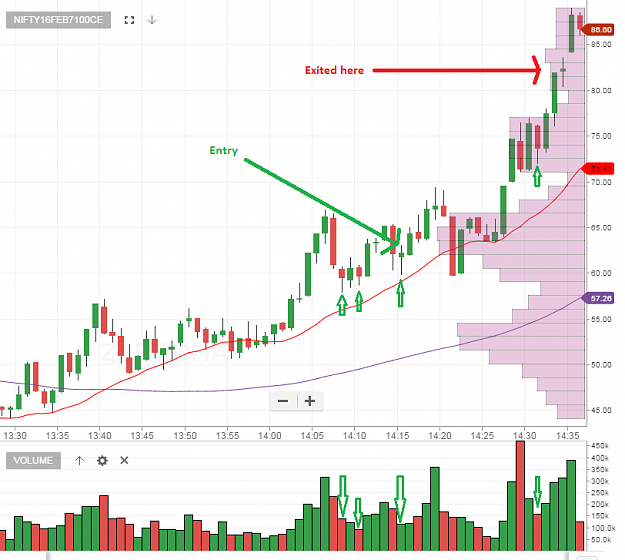
Test pattern has same features as in up trend but just do 1's complement of the chart.
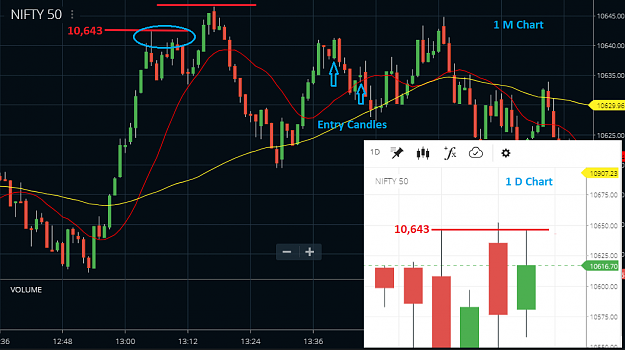
Example 5,
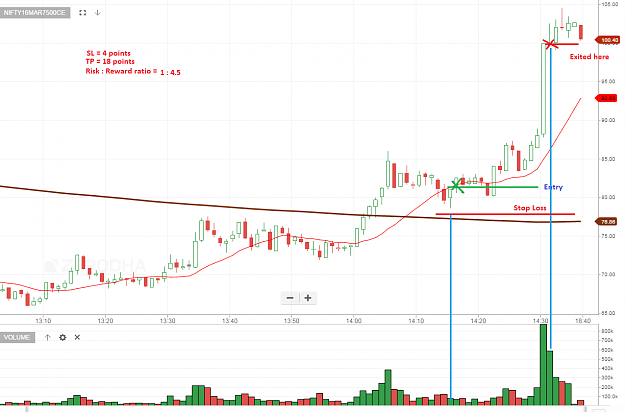
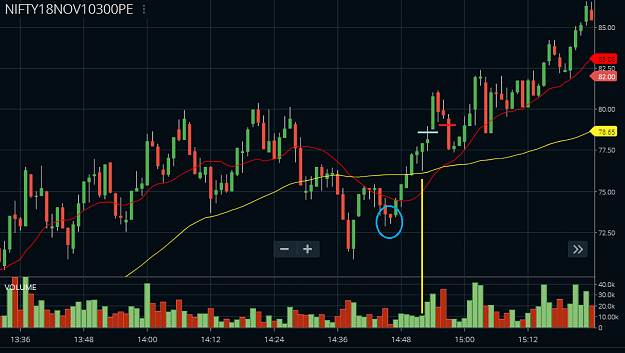
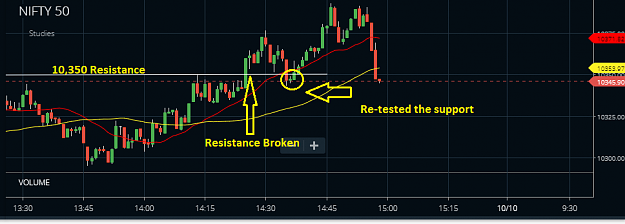
Example 6,
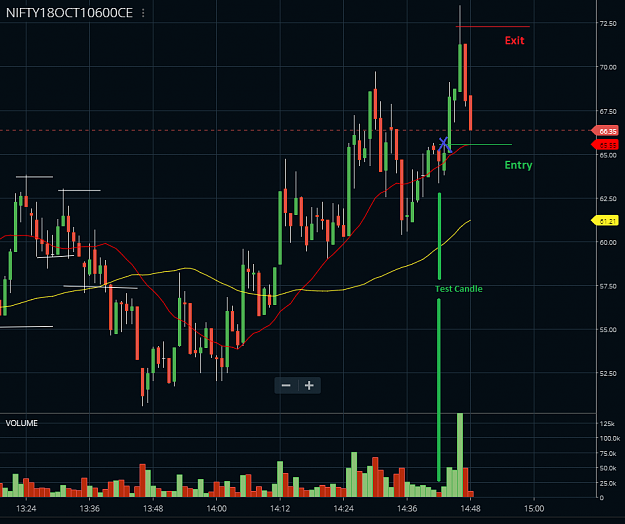
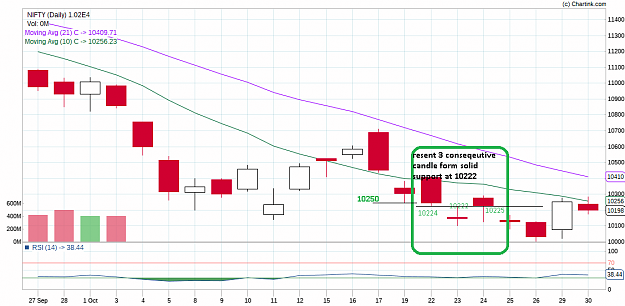
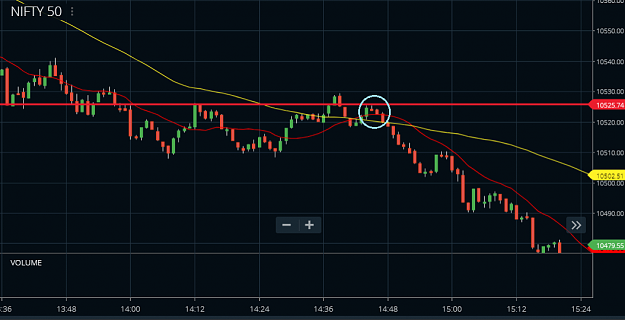
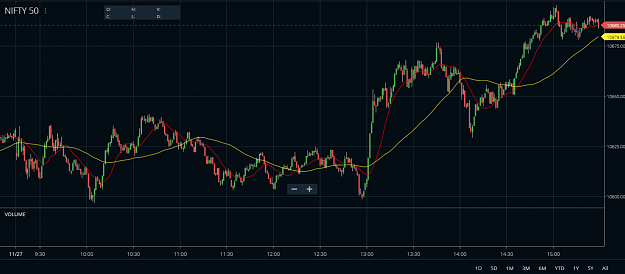
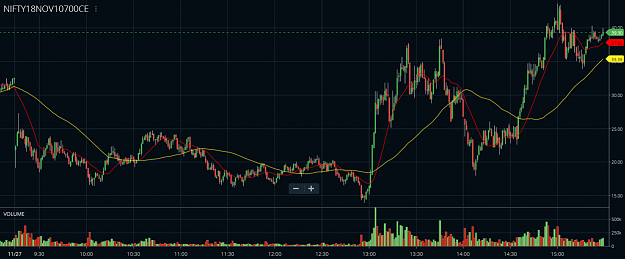
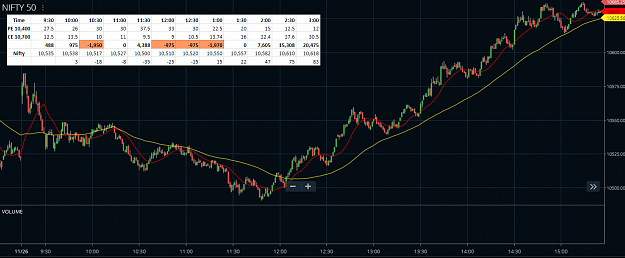
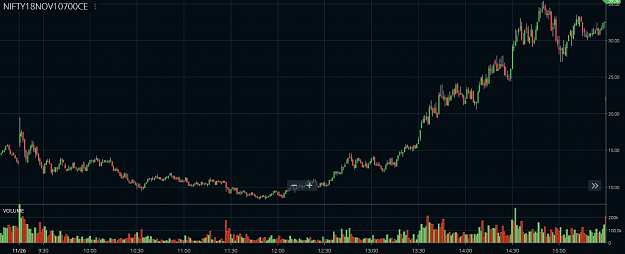
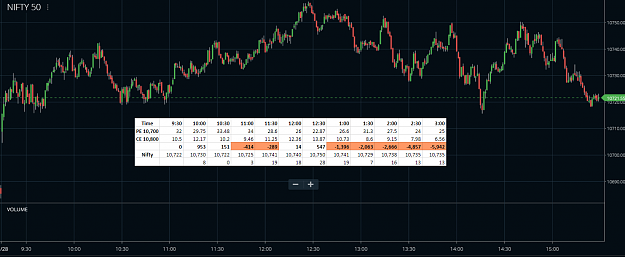
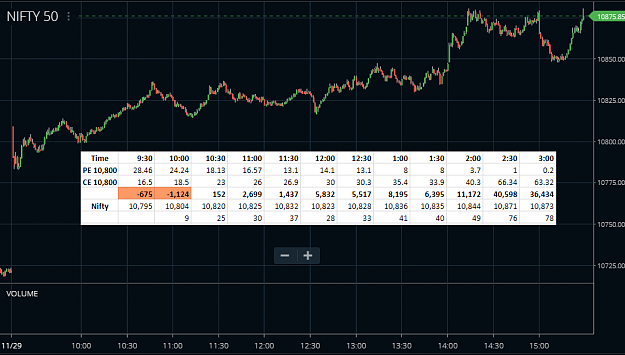
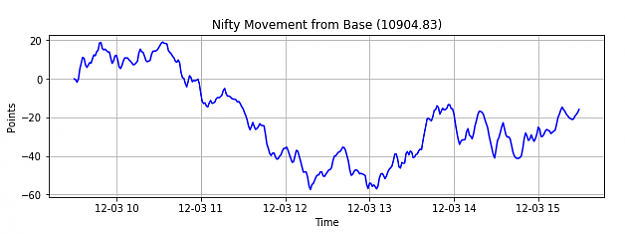
Lets see what NIFTY was doing at the same time, It broke a major resistance at 10,350. Once resistance line is broken, it will become support. Price revisited the support line(at 10350) and then went up again. So that is a confluence of test pattern and SR.
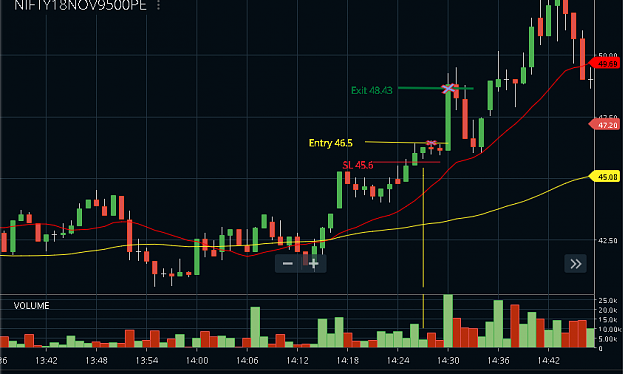
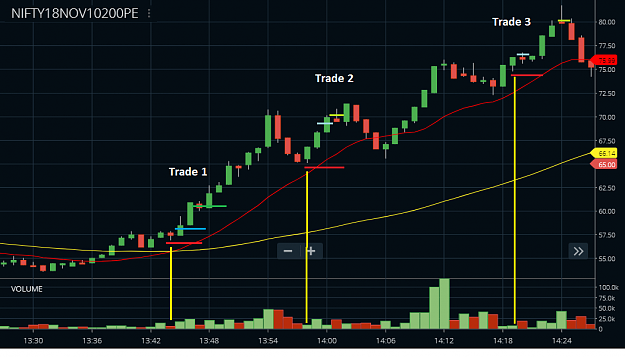
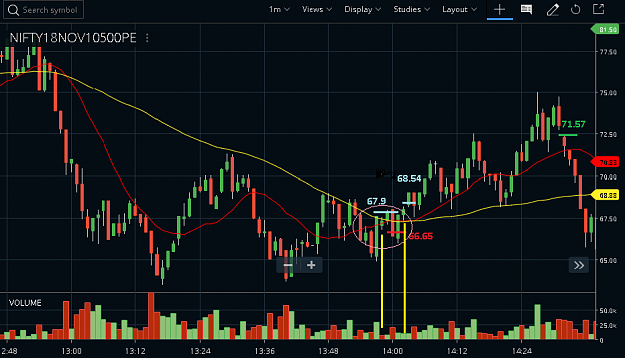
Example 7,
Testing Supply:
Testing is a low volume buy/sell signals. Will be discussing in context of long entries but same applicable for short signals as well. Rallies are short lived if there is supply in the background. Smart Money(SM) knows that the floating supply can be removed from the market. But they have to be sure that the supply has been completely removed before trying to trade up. The best way to find out this is to rapidly mark the prices down. This challenges any bears to come out. The amount of volume(activity) as the market is marked down will tell how much selling there is.
Low volume shows little selling on mark down. High volume shows that there is selling(supply) on the mark down. This process is called Testing. Testing is a good sign of market strength. But make sure that you have strength in background. This can be a stopping volume for eg. A successful test usually takes the market up immediately. Unsuccessful test usually results in a temporary up move and will be marked down sooner to re test.
Example 1,
Attached Image (click to enlarge)
Example 2,
Attached Image (click to enlarge)
Example 3,
confluence of "rejection from nifty resistance line" and "test pattern on 7200PE option".
Below is the Nifty daily chart showing a resistance line on daily, the lowest point on 19th feb. ie 7146
Attached Image (click to enlarge)
Now lets zoom inside to M1 time frame and see whats the price action around this area. Price tried to break through the resistance once, but failed. It tried again failed again with a nice bearish candle. Note the current candle time 2:55 PM which we will correlate with the option chart.
Attached Image (click to enlarge)
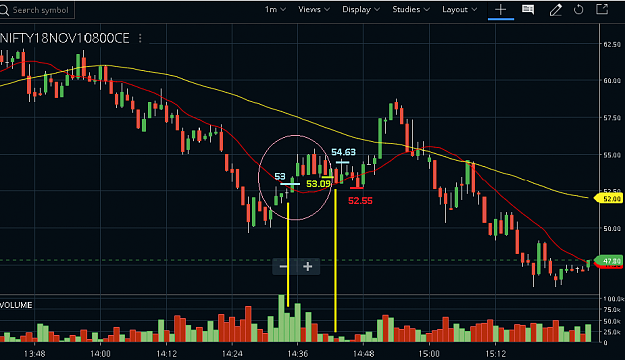
Below chart is the NIFTY7200PE options chart. Here you can see the test pattern.
Attached Image (click to enlarge)
Example 4,
Test pattern has same features as in up trend but just do 1's complement of the chart.
Attached Image (click to enlarge)
Example 5,
Attached Image (click to enlarge)
Example 6,
Attached Image (click to enlarge)
Lets see what NIFTY was doing at the same time, It broke a major resistance at 10,350. Once resistance line is broken, it will become support. Price revisited the support line(at 10350) and then went up again. So that is a confluence of test pattern and SR.
Attached Image (click to enlarge)
Example 7,
Attached Image (click to enlarge)