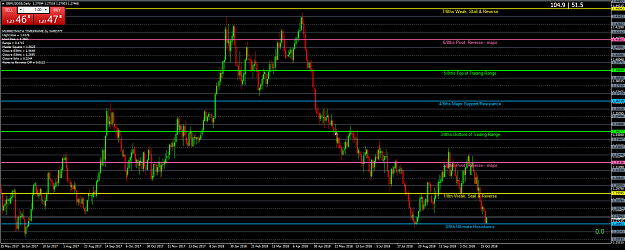
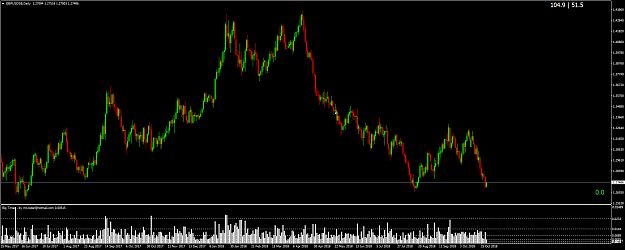
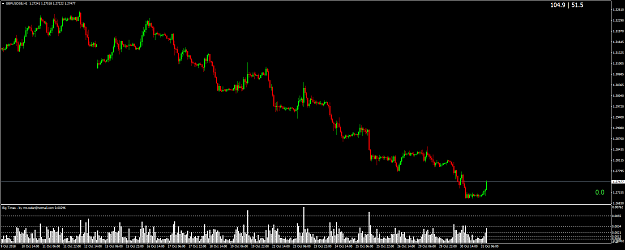
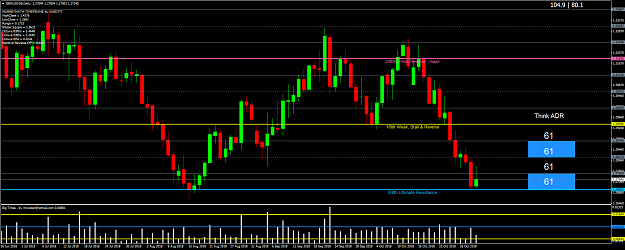
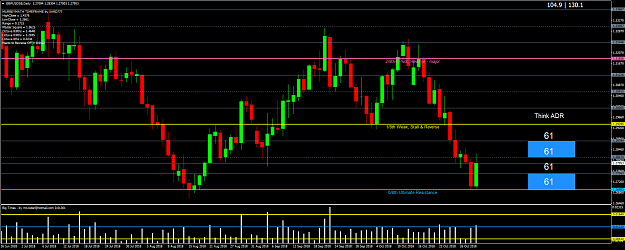
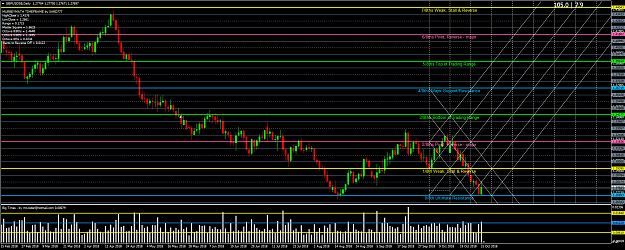
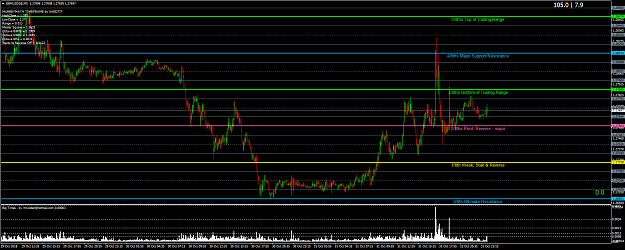
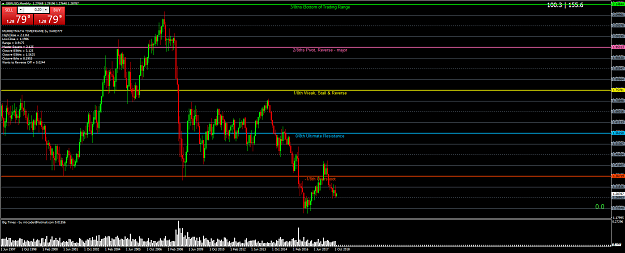
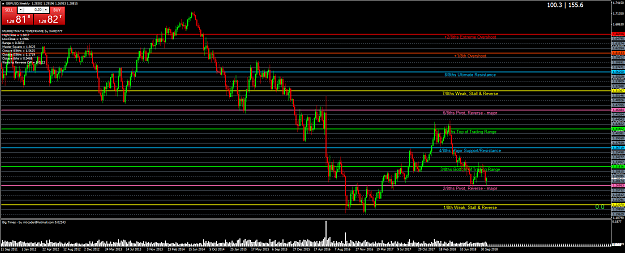
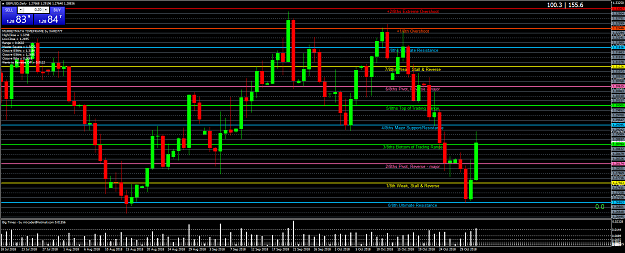
DislikedAUD/USD The price on the daily chart sits at a yearly low and that is situated in the 0/8 - -1/8 area. It seems to hold as it resulted in a quad pattern on the line ( close to the D letter ) and a pinbar later on. There has been also an AB-CD pattern completed. On the weekly chart we have also a quad and another pinbar. The black line serves as support on daily, weekly and monthly timeframe, being the lowest price in the 52 weeks. Also on the weekly the AB-CD pattern is completed On the monthly chart the price sits on the black line acting as support...Ignored
Market is a bit restless at the moment with some whipsaw type of activity considering the upcoming trade talks.
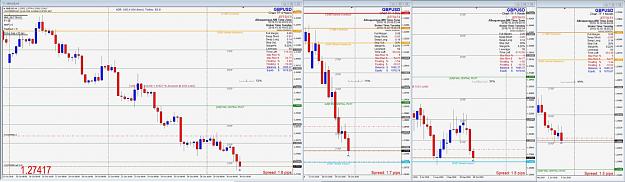
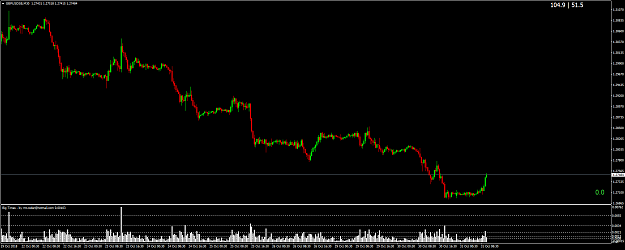
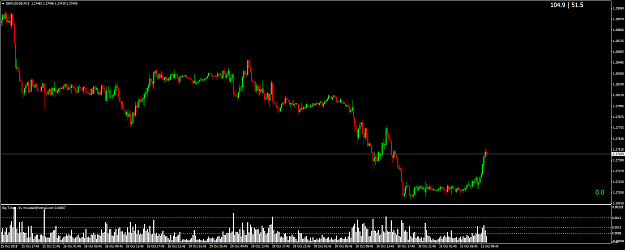
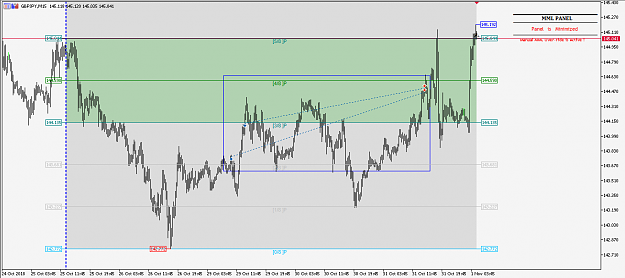
As for GJ I'm only after a 2c move up the chart and although the setup started off very nicely it has now taken a nose dive.
Attached Image (click to enlarge)
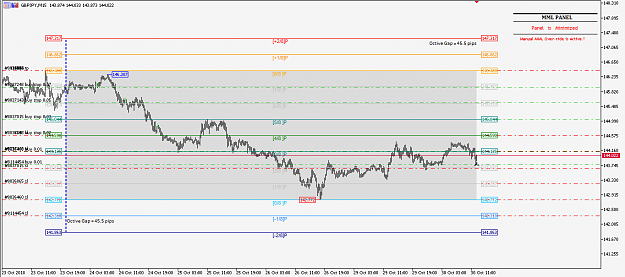
Stops on both open trades remain at or below the current swing low (0/8 and -1/8) so I'm going to leave them where they are for the time being.
The danger is that for GJ it does not take much of a move to the downside to wipe out those stops especially considering that this Grid sports a small 45.5 pip octive gap (manual MML applied).
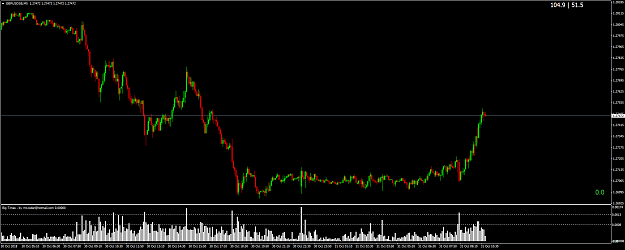
I'm looking for price to hold at or close to the 144 handle and then for the bulls to come onboard and push price up to 145 through to 146 levels.
Come on bulls !
Masterrmind.............
Master your Mind then Master your Trades
1