• Home
  • Forums
  • Trades
  • News
  • Calendar
  • Market
  • Brokers
  • Login
  • Join
  • User/Email: Password:
  • 6:42pm
Menu
  • Forums
  • Trades
  • News
  • Calendar
  • Market
  • Brokers
  • Login
  • Join
  • 6:42pm
Sister Sites
  • Metals Mine
  • Energy EXCH
  • Crypto Craft

Options

Bookmark Thread

First Page First Unread Last Page Last Post

Print Thread

Similar Threads

DanUK's Advanced Trend Trading Strategy 1,222 replies

Trend is your friend - supertrend indicator discussion 17 replies

Trend is your friend - Supertrend indicator discussion 6 replies

simple trend method, discussion requested 8 replies

Trading Discussion on Advanced Topics 3 replies

  • Commercial Content
  • /
  • Reply to Thread
  • Subscribe
  • 52
Attachments: Advanced discussion about trend lines
Exit Attachments

Advanced discussion about trend lines

  • Last Post
  •  
  • 1 2 Page 3
  • 1 2 Page 3
  •  
  • Post #41
  • Quote
  • May 3, 2017 2:28pm May 3, 2017 2:28pm
  •  Lindman
  • | Commercial Member | Joined Jan 2016 | 240 Posts
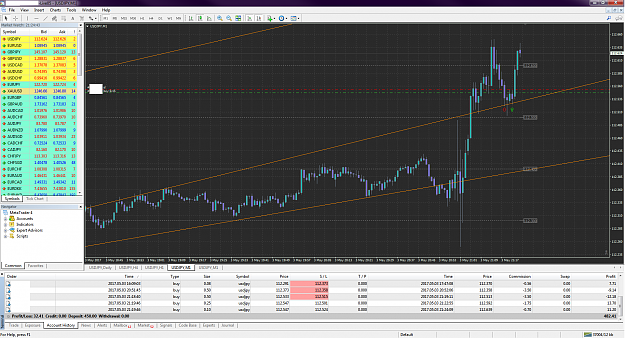
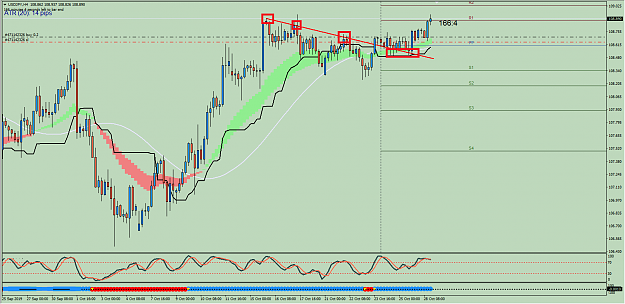
Stopped out for 1.8 pips. Reenter on favourable price action, FOMC causing delay in market execution from my broker, nonetheless got an okay entry in. Took partial profits to cover losses. Letting the last partial position run, set stop to B/E. EDIT: blanked out some order numbers.
Attached Image (click to enlarge)
Click to Enlarge

Name: UJ2.png
Size: 147 KB
 
 
  • Post #42
  • Quote
  • May 3, 2017 7:04pm May 3, 2017 7:04pm
  •  daivid40
  • | Commercial Member | Joined Sep 2013 | 81 Posts

Guys, I created this thread for advanced discussion about TLs at first but when no one had any ideas about trend lines to discuss, I started teaching my method. So please either write something productive or find another place to continue your fight otherwise I have to clear your posts and ban you despite my willingness. And please don't clutter this thread with your results or pics that are irrelevant to this topic. I don't think anyone is interested in unrelated posts that you want to write to win a stupid fight.

 
2
  • Post #43
  • Quote
  • May 3, 2017 7:08pm May 3, 2017 7:08pm
  •  daivid40
  • | Commercial Member | Joined Sep 2013 | 81 Posts

The next setup is one of the most reliable and profitable ones and that's where a line is broken and the price comes back to that again. That's the place where we enter the position with a good rr and we can be confident that our position will hit the target with a high chance. It can happen at the end of a trend where the price changes its direction or during a trend where the price continues its previous trend. It's basically something like the setup explained in the post 19. The difference is that in that setup the line is in the direction of its break, for example the line is downward in a downtrend and price breaks it and gets back to it later, but here the line is either in the opposite direction of its break or is (somehow) horizontal like a support or resistance.

I've explained some more details in the following pictures:

Attached Image (click to enlarge)
Click to Enlarge

Name: AUDUSDkMonthly.png
Size: 36 KB

Attached Image (click to enlarge)
Click to Enlarge

Name: AUDUSDkM15.png
Size: 38 KB

Attached Image (click to enlarge)
Click to Enlarge

Name: AUDUSDkH1.png
Size: 31 KB

Attached Image (click to enlarge)
Click to Enlarge

Name: EURUSDkWeekly.png
Size: 38 KB


There are some subjects that I'd like to write a few lines about.


First, I'll try to write some tips about this method whenever I see them in a picture.


Secondly, remember that this method is a multi-timeframe method. You have to analyze the chart completely and precisely according to setups that have been told and are going to be written in the future posts and then choose the right time to enter a position otherwise it would be easy for everyone to make profit by drawing a few lines in their charts. We all know it's not like that, so read every post carefully and several times and try to be implement them thoroughly otherwise you won't see your desired results. I mean every word in every post and they are not just some overnight oracles that have been revealed to me. They are years of experience and have been tested in different situations of the market over and over. So please don't skim them or take them for granted and be as much precise as you have to. I wrote this because I saw some posts with the least consideration to the details that have been told so far. I can assure you this method is so profitable but only in the hands of a disciplined trader who follows all the rules carefully.


There are an important chapter about line correction and guide candle(s) that I should have written about before because you need them whenever you draw a line. I didn't know where to put this chapter because on the one hand you need knowing them for drawing any line, on the other hand you should be familiar with this method to some extend first. anyway, I'll try to explain those concepts in the future post.

 
1
  • Post #44
  • Quote
  • May 3, 2017 9:55pm May 3, 2017 9:55pm
  •  Lindman
  • | Commercial Member | Joined Jan 2016 | 240 Posts
Quoting daivid40
Disliked
Guys, I created this thread for advanced discussion about TLs at first but when no one had any ideas about trend lines to discuss, I started teaching my method. So please either write something productive or find another place to continue your fight otherwise I have to clear your posts and ban you despite my willingness. And please don't clutter this thread with your results or pics that are irrelevant to this topic. I don't think anyone is interested in unrelated posts that you want to write to win a stupid fight.
Ignored
I apologize David, you are absolutely right. I dropped in and gave my insight, then got sucked in when I was accosted and challenged by the hypocrite. Goodbye and good luck in your trading!
 
 
  • Post #45
  • Quote
  • May 4, 2017 5:41am May 4, 2017 5:41am
  •  Landline
  • Joined Jan 2014 | Status: Member | 1,686 Posts
Quoting daivid40
Disliked
Guys, I created this thread for advanced discussion about TLs at first but when no one had any ideas about trend lines to discuss, I started teaching my method. So please either write something productive or find another place to continue your fight otherwise I have to clear your posts and ban you despite my willingness. And please don't clutter this thread with your results or pics that are irrelevant to this topic. I don't think anyone is interested in unrelated posts that you want to write to win a stupid fight.
Ignored
Yes, you are right. In any case, my suspicions over wild claims (on an m1 t/f lol) have now been confirmed...job done.

Good luck with your marathon set of rules, sub-rules and sub-sub-rules etc, I prefer simplicity and will be a silent observer in your thread from now on.
 
 
  • Post #46
  • Quote
  • May 4, 2017 2:14pm May 4, 2017 2:14pm
  •  FXRooster
  • | Joined Jun 2016 | Status: Member | 22 Posts
Here's some ideas about trend lines I have which I think are pretty good maxims about trend line trading. Some will find these points debatable. Healthy debate is good, I think. I want to hear from people whose opinions differ from my own, if they are well thought and rational.


  1. I like automatic, trend line drawings systems and bots to trade trend lines automatically.
  2. Automatic systems lack human intuition and intelligence, hence they can in some ways be inferior.
  3. Automatic trend line drawings are usually cleaner and more accurate than a person draws in practice. You can specify exact points of a trend line for very clean drawings. That's too much work for me
  4. Both the H/L and candle close provide S/R.
  5. The third hit on a trend line is the most important hit and has a very high percentage of price reversal, at least in the short term.
  6. The more rejections of a trend line, the stronger the trendline is.
  7. Higher TF trend lines are stronger than lower TF.
  8. If price hugs a trend line (or any S/R) it will likely breakthrough.
  9. If price is above any trend line, price is considered bullish in relation to the trend line. Below = bearish. The key phrase is "in relation to that trend line".
  10. Closes above or below the trend line carry more weight than tails.
  11. A trend line indicates resistance to price moving in that direction.
  12. Trend lines are usually found in corrective structures and should be viewed in context of a larger framework of impulse waves.
  13. Trend lines work well combined with OBOS conditions.
  14. Just because a trend line is broken by price action does not mean price will not continue to find S/R at that trend line.
  15. Some trend lines are predictive like Gann/Fib angles and previous angles that price has respected. This means that you can predict S/R based on one single pivot point and one angle.
  16. Horizontal S/R is more important than trend lines.
  17. Confluence of S/R is more important than singular instances of S/R.
  18. Every single candle OHLC is S/R.
  19. Volume can help determine breakout strength of any S/R.
  20. Any S/R is also a profit target in addition to being a low RvR entrance. As such, price often accelerates towards S/R.

 
3
  • Post #47
  • Quote
  • May 4, 2017 9:37pm May 4, 2017 9:37pm
  •  daivid40
  • | Commercial Member | Joined Sep 2013 | 81 Posts

Since we have several setups in this strategy along with some details that need to be followed thoroughly so I think it could be a good idea that people who are interested in this thread find the situations and setups related to this thread and post them so that the aspects of this strategy can be practiced and more tangible. Something like what Artcool did in some previous posts. It doesn't matter if you make some mistakes, it's important that you can be familiar with the setups more and get used to them. There are not many rules for this purpose, you just need to find the setups told in this thread and post them. Try to analyze the market in a multi-timeframe fashion according to the setups and find the best positions. As the thread moves forward and I talk about other setups, you can include them in your analysis as well. Just please follow these 2 points. 1- Do a multi-timeframe analysis and find the best timeframe in your positions 2- Do it according to the setups of this thread. Try to be as precise as possible and remember that even 1 candle is important while drawing a line. If the people of this thread are active and show interest, I'll find more energy and motivation to talk about more setups and details. In the meantime, I'll welcome any tested and valuable personal study done by anybody in this field, not some rudimentary stuff that you can find in some books or unexamined ideas or thoughts.

 
1
  • Post #48
  • Quote
  • Edited at 1:09pm Oct 20, 2018 6:30am | Edited at 1:09pm
  •  lotikhim
  • | Joined Oct 2018 | Status: Junior Member | 5 Posts
Hi I dont know if its too late, I have studied alot on charts lately, its been 5 years but only about 9 months of serious daytrading and I THINK I am starting to understand how the market works. I believed alot in chart patterns but recently I try to find out why some of the chart patterns work and yet the same doesnt work at other times. I even research about self fulfilling prophecy of TA , which also kind of led me to this topic, coupled with alot of common topics such as RR, WR , MM etc. Sorry if it is very messy here because there are many things in my mind and I only studied this for 3days. But I have alot of thoughts to it... And I almost think this is the holy grail to forecasting. I studied for 10hours + a day on charts for this half a year. And watched so many hours of videos over the past years etc. I trade equities only. The latest chart you showed that you say is mostly profitable. I frequently use it on a 5min chart for daytrading. Recently, I started looking more on to weekly charts, monthly, daily and hourly. And I realised that I have been too short term minded to just look at the 5min moves. I am not saying that it is pointless, it's just that it got me not trading in the long term trend. But I assume it will not work when lets say in the future I have too big amount of capital to trade. Liquidity will be an issue. Anyway, I came a long way and keep in mind I have some views about that market, and that is 1) The market is formed by emotions of buyers and sellers, which leads to demand and supply 2) Seeing all timeframes= Seeing what EVERYONE sees, which means those trendlines/ S/R drawn by everyone based on their timeframes, are a potential to reaction. 3) Those chart patterns in different timeframe formed, will lead to the emotions of TRAPPED BULLS OR BEARS, which leads to point 1, demand and supply. 4) Smart Money buy or sell on anticipation to REDUCE RISK, hence always on S/R. 5) Trendlines or horizontal S/R intersecting with each other from any TF can be very significant.

Putting everything together it means cluster of buy and sell order can be anticipated in every point of those trendlines and horizontal S/R. And the higher TF seem to be more significant. Near major resistance would mean selling pressure and smart money will not want to risk buying at breakout, rather wait for pullback if neccessary. IMO, the latest chart you showed that you say was profitable, correct me if am wrong, the top was near to a Major resistance, and the run up was long enough to exhaust all the buying pressure, leaving all the bulls trapped. And smart money would have anticipated that exhaustion and hence short on that pop. Any further downmove was due to increased selling pressure due to everyone looking at the chart thinking ' this is a nice chart for short opportunity since theres a break of that support and I will wait for a pullback to enter', hence even triggering more supply.

Now with my limited time studying this, I come to think that every movement, from LTF to HTF, they are all interelated. Which makes the stock market bounce/ react/ have more relative volume on ALL significant points of S/R.

Could that mean that we can forecast the point of major events? Lol Im not sure yet. Just my thoughts after 2 days of research. I will be putting all my time here.

PS: Anyway lets keep it clear that horizontal or diagonal trendlines all act as S/R since i use them interchangeably which i know is confusing
 
 
  • Post #49
  • Quote
  • Oct 20, 2018 6:34am Oct 20, 2018 6:34am
  •  lotikhim
  • | Joined Oct 2018 | Status: Junior Member | 5 Posts
I also want to say that a 5min candle could be just working its way to form that 1hour candle JUST TO test a major support or resistance.
 
 
  • Post #50
  • Quote
  • Oct 20, 2018 1:06pm Oct 20, 2018 1:06pm
  •  lotikhim
  • | Joined Oct 2018 | Status: Junior Member | 5 Posts
Also, I keep into consideration that the smart money will buy when sellers exhausted vice versa, and the exhaustion increases everytime it passes through over a SERIES of S/R / Trendline points
 
 
  • Post #51
  • Quote
  • Oct 20, 2018 1:53pm Oct 20, 2018 1:53pm
  •  lotikhim
  • | Joined Oct 2018 | Status: Junior Member | 5 Posts
Sorry for spamming as I get more ideas.

If a HTF has more impact on LTF, meaning S/R of HTF has a higher impact on LTF, so price bounces AS EVERY MINUTE PASSES according to the many S/R of all time frames, eventually leading to the HTF being the strongest. theoretically , it is possible to predict the movement of price into the future. Assuming that news has little impact on HTF Chart.
 
 
  • Post #52
  • Quote
  • Oct 21, 2018 11:29pm Oct 21, 2018 11:29pm
  •  navycdr1
  • | Joined Aug 2018 | Status: Member | 16 Posts
Beyond the "standard", old school TL concepts I have played with a few new ideas. 1- combining with MA's. Connect knees or bends in avg lines, or find a flat run that almost looks like a TL and extend it out. 2-simply extend an ma line to help with lag.
Endless options to try out and see what you like! No need to simply subscribe to what others think is correct or incorrect TL drawing!

"The Holy Grail is "the search" for it! ie The journey IS the destination!
 
 
  • Post #53
  • Quote
  • Oct 25, 2018 4:21am Oct 25, 2018 4:21am
  •  lotikhim
  • | Joined Oct 2018 | Status: Junior Member | 5 Posts
Quoting navycdr1
Disliked
Beyond the "standard", old school TL concepts I have played with a few new ideas. 1- combining with MA's. Connect knees or bends in avg lines, or find a flat run that almost looks like a TL and extend it out. 2-simply extend an ma line to help with lag. Endless options to try out and see what you like! No need to simply subscribe to what others think is correct or incorrect TL drawing! "The Holy Grail is "the search" for it! ie The journey IS the destination!
Ignored
Yes it can be subjective, but the more 'obvious' a trendline is, the more people use. Besides, the market is made by behavior of people. And coupled with multi time frames, the more we can see what others are looking at.
 
 
  • Post #54
  • Quote
  • Dec 27, 2018 11:12pm Dec 27, 2018 11:12pm
  •  waylonayman
  • | Joined Dec 2018 | Status: Junior Member | 1 Post
Hi David40. Please continue the discussion on trendlines. It's been a year since you posted something. The knowledge you were sharing is concise and easy to understand. I would request you to complete the thread you started with everything you know step by step. Thank you.
 
 
  • Post #55
  • Quote
  • Dec 28, 2018 12:00pm Dec 28, 2018 12:00pm
  •  Swisse
  • Joined Jun 2015 | Status: Member | 102 Posts
Guys, I know I'm ruining the conversations of trend lines, so eloquently talked about here but, I feel this information is of much use.

When humans came about, we drew these lines-- think basic geometry: circle, square, lines. When we saw a tree, we thought of lines, how to control the artistry of nature somewhat. This is how geometry was made. We drew maybe two parallel lines and a circle and showed it as a tree to a comrade.

What people do not realize in this WHOLE forum is just that. We know our drawings of a tree weren't even enough to describe a tree. Heck we still don't know 100% with quantum biology, and 3D rendering in computers. BUT what we do know is we have more technology to help us measure a tree much better than a line. If you look at waves in nature, you don't just draw them with lines (Elliot wave theory and kindergarten). It's prehistoric and somewhat of a caveman way to describe reality. I don't just take my phone snap a photo, and put a line of where I think the wave is going to possibly be around in. (this is nonsense).
Here's a bit of how fluid & flow mechanics is tracked with two perspectives. All of which are richer in information than lines. All of which I haven't even really seen being mentioned. Trading is not about how to make data look like it's in some box. It's actually quite the opposite. This can give some ideas when it comes to tracking flow and motion.
Inserted Video


Inserted Video
 
5
  • Post #56
  • Quote
  • Last Post: Oct 28, 2019 10:21am Oct 28, 2019 10:21am
  •  MrDarren
  • | Membership Revoked | Joined Jun 2016 | 158 Posts
trendline as well as horizontal support resistance, look for positions where prices often touch trendline lines
Attached Image (click to enlarge)
Click to Enlarge

Name: Untitled2.png
Size: 61 KB
 
 
  • Commercial Content
  • /
  • Advanced discussion about trend lines
  • Reply to Thread
    • 1 2 Page 3
    • 1 2 Page 3
0 traders viewing now
Top of Page
  • Facebook
  • Twitter
About FF
  • Mission
  • Products
  • User Guide
  • Media Kit
  • Blog
  • Contact
FF Products
  • Forums
  • Trades
  • Calendar
  • News
  • Market
  • Brokers
  • Trade Explorer
FF Website
  • Homepage
  • Search
  • Members
  • Report a Bug
Follow FF
  • Facebook
  • Twitter

FF Sister Sites:

  • Metals Mine
  • Energy EXCH
  • Crypto Craft

Forex Factory® is a brand of Fair Economy, Inc.

Terms of Service / ©2022