Hi guys,
I would like to share an indicator I just developed with you.
It's based on the fact that, within a candle (so basically within a certain amount of time), markets tend to move significantly more in one direction than in the other.
Let me explain this better:
We all know how to calculate the range of a candle: HIGH-LOW.
I divide this range in two parts and call them "long tail" and "short tail", by calculating the range between the HIGH and the OPEN on one hand, and the range between the LOW and the OPEN on the other hand. The sum of those 2 ranges is obviously equal to the total range (HIGH-LOW).
Like I said before, the highest of both ranges (long tail) very often is significantly higher than the lowest (short tail).
What I also noticed is that if over a period of time (let's say the last 50 candles) the long/short tail of a candle is smaller or equal to a certain amount of pips for x% of the time, it is very likely that also AFTER that the long/short tail will be smaller or equal to the same amount of pips for the same % of the time ...
Example: if for the EUR/USD on the daily chart, we compare each candle's long/short tail with the median (which means that 50% of the time the value was smaller or equal to this number -> the median) of the long/short tail of the previous x (ex. 50) candles, we will see that in +/-50% of the cases the long/short tail of the candle will be equal or smaller than that median.
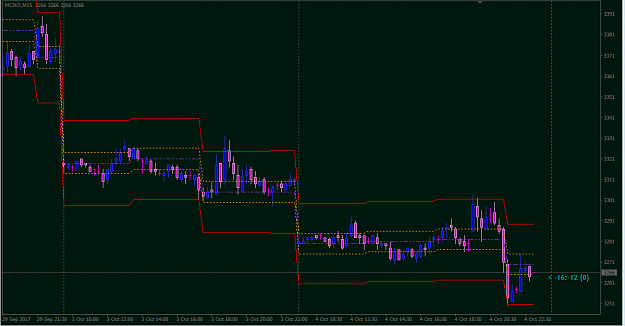
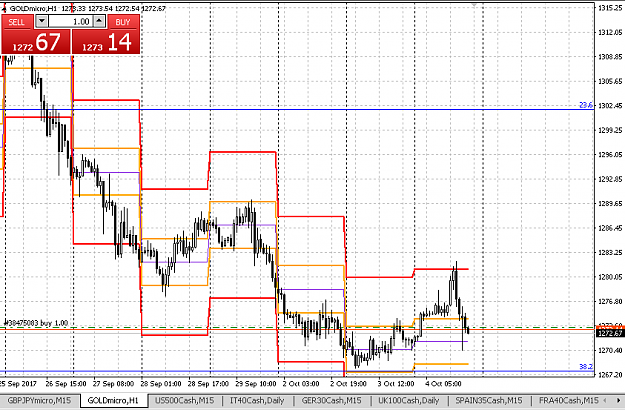
The goal of the indicator is to plot above and below the open (with this indicator we do not attempt to predict the direction of the market at the open) the short and long tail of the requested probability (50% = median, means that 50% of the time it will be smaller or equal to the plotted level, but any percentage can be inserted as a parameter).
Let's skim over the input and output variables of the indicator:
INPUT:
Plot on latest x candles: Number of candles on which you want to plot the output (can be set to infinite)
#ST hist candles: Number of historic candles (in requested timeframe, see below) to use for calculating the Short Tail
#LT hist candles: Number of historic candles (in requested timeframe, see below) to use for calculating the Short Tail
TimeFrame: Timeframe (in minutes, so daily would be 1440) of which you want to calculate the Short/Long Tail. 0 means the timeframe of the chart you use the indicator on. Example: If you want to see the daily Long/Short tail on a 15M chart, drop the indicator on a 15m chart and set this parameter to 1440.
ST Percentile: In how many % of the requested amount of previous candles (see above) has the Short Tail to be equal or smaller to the Short Tail value that will be plotted ?
LT Percentile: In how many % of the requested amount of previous candles (see above) has the Long Tail to be equal or smaller to the Short Tail value that will be plotted ?
PCT or PTS: Do you want to calculated the Tails as a percentage (PCT) or in pips/points (PTS) ?
Included weekdays (1-7) for hist: If you only want to take into account historic candles of certain weekdays, input the day(s) you want. Ex: 1,2,3,4 Leave this empty if you do not want to filter out any days. Btw: 1=Monday ..... 7=Sunday.
Included months (1-12) for hist: If you only want to take into account historic candles of certain months, input the month(s) you want. Ex: 1,2,3,4 Leave this empty if you do not want to filter out any months.
Hist date range start (included) & Hist date range end (excluded): If you only want to use historic candles of a certain period of time to calculate the Tails, enter it here. Leave it on 1/1/1970 if you don't want the limit the time.
Hist time range start (included) & Hist time range end (included): If you only want to use historic candles of a certain time during the day, insert the start and the end of the time range you want. Only the time entered here is taken into consideration, not the date. Leave it on 1/1/1970 if you don't want the limit the time.
OUTPUT:
Short Tail +: This is the short tail (calculated as per the inputted variables) plotted above the open
Short Tail -: This is the short tail (calculated as per the inputted variables) plotted below the open
Long Tail +: This is the long tail (calculated as per the inputted variables) plotted above the open
Long Tail -: This is the long tail (calculated as per the inputted variables) plotted below the open
LT candle: This is the Long Tail of the candle you are hovering over (not plotted, only shown in the data window)
ST candle: This is the Short Tail of the candle you are hovering over (not plotted, only shown in the data window)
Number candle: This is Metatraders' number of the candle you are hovering over (not plotted, only shown in the data window). Reminder: the most recent candle is 0, the one before is 1, .......(not plotted, only shown in the data window)
First hist candle: This is Metatraders' number of most recent historic candle (of the requested timeframe) used the calculate the Long/Short tail (not plotted, only shown in the data window)
Last hist candle LT: This is Metatraders' number of oldest historic candle (of the requested timeframe) used the calculate the Long Tail (not plotted, only shown in the data window)
Last hist candle ST: This is Metatraders' number of oldest historic candle (of the requested timeframe) used the calculate the Short Tail (not plotted, only shown in the data window)
# hist candles LT: Number of historic candles used to calculate Long Tail. This can be lower than the requested number of historic candles to use, for example if you set some filters in the input parameters (not plotted, only shown in the data window)
# hist candles ST: Number of historic candles used to calculate Short Tail. This can be lower than the requested number of historic candles to use, for example if you set some filters in the input parameters (not plotted, only shown in the data window)
Open: This is the open based on which the Tails are plotted. For example: if you visualize daily Tails on the 15m chart, this is the daily open and remains the same throughout the day on the 15m chart and changes at the open of a new daily candle (plotted).
I hope I have been able to explain quite clearly what I mean and what the indicator does :-).
Please let me know what you think or if you have any questions/suggestions.
Cheers !
P.S. For the programmers among you: I am a Belgian living in Italy, so in the code I write in Dutch, English and Italian at the same time , sorry for that ...
I would like to share an indicator I just developed with you.
It's based on the fact that, within a candle (so basically within a certain amount of time), markets tend to move significantly more in one direction than in the other.
Let me explain this better:
We all know how to calculate the range of a candle: HIGH-LOW.
I divide this range in two parts and call them "long tail" and "short tail", by calculating the range between the HIGH and the OPEN on one hand, and the range between the LOW and the OPEN on the other hand. The sum of those 2 ranges is obviously equal to the total range (HIGH-LOW).
Like I said before, the highest of both ranges (long tail) very often is significantly higher than the lowest (short tail).
What I also noticed is that if over a period of time (let's say the last 50 candles) the long/short tail of a candle is smaller or equal to a certain amount of pips for x% of the time, it is very likely that also AFTER that the long/short tail will be smaller or equal to the same amount of pips for the same % of the time ...
Example: if for the EUR/USD on the daily chart, we compare each candle's long/short tail with the median (which means that 50% of the time the value was smaller or equal to this number -> the median) of the long/short tail of the previous x (ex. 50) candles, we will see that in +/-50% of the cases the long/short tail of the candle will be equal or smaller than that median.
The goal of the indicator is to plot above and below the open (with this indicator we do not attempt to predict the direction of the market at the open) the short and long tail of the requested probability (50% = median, means that 50% of the time it will be smaller or equal to the plotted level, but any percentage can be inserted as a parameter).
Let's skim over the input and output variables of the indicator:
INPUT:
Plot on latest x candles: Number of candles on which you want to plot the output (can be set to infinite)
#ST hist candles: Number of historic candles (in requested timeframe, see below) to use for calculating the Short Tail
#LT hist candles: Number of historic candles (in requested timeframe, see below) to use for calculating the Short Tail
TimeFrame: Timeframe (in minutes, so daily would be 1440) of which you want to calculate the Short/Long Tail. 0 means the timeframe of the chart you use the indicator on. Example: If you want to see the daily Long/Short tail on a 15M chart, drop the indicator on a 15m chart and set this parameter to 1440.
ST Percentile: In how many % of the requested amount of previous candles (see above) has the Short Tail to be equal or smaller to the Short Tail value that will be plotted ?
LT Percentile: In how many % of the requested amount of previous candles (see above) has the Long Tail to be equal or smaller to the Short Tail value that will be plotted ?
PCT or PTS: Do you want to calculated the Tails as a percentage (PCT) or in pips/points (PTS) ?
Included weekdays (1-7) for hist: If you only want to take into account historic candles of certain weekdays, input the day(s) you want. Ex: 1,2,3,4 Leave this empty if you do not want to filter out any days. Btw: 1=Monday ..... 7=Sunday.
Included months (1-12) for hist: If you only want to take into account historic candles of certain months, input the month(s) you want. Ex: 1,2,3,4 Leave this empty if you do not want to filter out any months.
Hist date range start (included) & Hist date range end (excluded): If you only want to use historic candles of a certain period of time to calculate the Tails, enter it here. Leave it on 1/1/1970 if you don't want the limit the time.
Hist time range start (included) & Hist time range end (included): If you only want to use historic candles of a certain time during the day, insert the start and the end of the time range you want. Only the time entered here is taken into consideration, not the date. Leave it on 1/1/1970 if you don't want the limit the time.
OUTPUT:
Short Tail +: This is the short tail (calculated as per the inputted variables) plotted above the open
Short Tail -: This is the short tail (calculated as per the inputted variables) plotted below the open
Long Tail +: This is the long tail (calculated as per the inputted variables) plotted above the open
Long Tail -: This is the long tail (calculated as per the inputted variables) plotted below the open
LT candle: This is the Long Tail of the candle you are hovering over (not plotted, only shown in the data window)
ST candle: This is the Short Tail of the candle you are hovering over (not plotted, only shown in the data window)
Number candle: This is Metatraders' number of the candle you are hovering over (not plotted, only shown in the data window). Reminder: the most recent candle is 0, the one before is 1, .......(not plotted, only shown in the data window)
First hist candle: This is Metatraders' number of most recent historic candle (of the requested timeframe) used the calculate the Long/Short tail (not plotted, only shown in the data window)
Last hist candle LT: This is Metatraders' number of oldest historic candle (of the requested timeframe) used the calculate the Long Tail (not plotted, only shown in the data window)
Last hist candle ST: This is Metatraders' number of oldest historic candle (of the requested timeframe) used the calculate the Short Tail (not plotted, only shown in the data window)
# hist candles LT: Number of historic candles used to calculate Long Tail. This can be lower than the requested number of historic candles to use, for example if you set some filters in the input parameters (not plotted, only shown in the data window)
# hist candles ST: Number of historic candles used to calculate Short Tail. This can be lower than the requested number of historic candles to use, for example if you set some filters in the input parameters (not plotted, only shown in the data window)
Open: This is the open based on which the Tails are plotted. For example: if you visualize daily Tails on the 15m chart, this is the daily open and remains the same throughout the day on the 15m chart and changes at the open of a new daily candle (plotted).
I hope I have been able to explain quite clearly what I mean and what the indicator does :-).
Please let me know what you think or if you have any questions/suggestions.
Cheers !
P.S. For the programmers among you: I am a Belgian living in Italy, so in the code I write in Dutch, English and Italian at the same time
Attached Image (click to enlarge)
Attached File(s)
Winners never quit and quitters never win.