Disliked{quote} Dear Great ATA I want to specially thank you again for your great generosity in giving us these great trading tutorials. I have judiciously studied your system again this weekend and critically watched the pictures. I made the following deductions. A high probability trade setup occurs when there are: #1.... "Favourable" recent candle close price level relative to one or both of "London open price" and "60/54" LWMA &its slope. (ie candle close above to consider buys and below to consider sells) #2....LEGITIMATE BREAKOUT (candle 'close/open'...Ignored
Let me explain why:
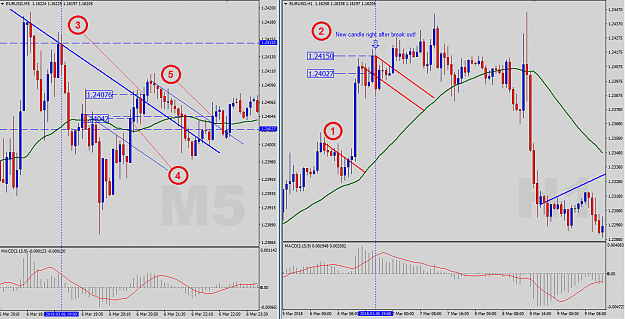
We all know that the market breathes differently in certain conditions, right? Depending on these conditions what we can call a slow market can take different interpretations. One day a 100 pips move can be considered as a fast or crazy day and then on days where we have very strong rallies or market crashes suddenly a 100 pips move becomes boring. So "pip" wise thinking always gets affected by the fact of "relativity". Therefore it can mislead you especially when you lean your strategy towards pips distance. I don't recommend that. I therefore want you to ignore the 2 cases and the x pips distance thing you came up with and solely focus at what I try to explain on chart below from date 06 March 2018. Please match each number on chart with my explanation list on this post:
- First when I looked at the Asian session breakout I already figured out the correct angle of the RED TL based on candle formation. That would help me later at point 2 to make use of the same line as a clone.
- Now, right after 18:00 o'clock candle just closed and the 19:00 o'clock candle just opened we had a confirmed H1 candle breakout!
I NEITHER ENTER LONG here just because we had a H1 candle close above RED TL, NOR I CHECK ANY X PIPS DISTANCE whatsoever.
Once I see the breakout occurred, I first clone a new RED TL to the fresh opened price level. I also mark the breakout price level at: 1.24027 and the closing price level at 1.2415. And after that I immediately start checking the M5 chart. - On the M5 chart I first put 2 horizontal lines to mark the breakout and closing levels from H1. The goal is to open the trade as close as it gets to breakout level. The lower the better. Then I look to draw a similar RED TL on M5 (I accidentally colored the lines BLUE on example chart but those are supposed to be RED trendlines actually, so apologizing for that mistake, but you got the idea). So I draw a thick blue trendline that will help me to see a new breakout. For that I simply used the 19:00 o'clock opening. I didn't know what will happen at that time. So I just watched. A little time later we can see that none of the following candles could achieve a new breakout. So I keep waiting until candles eventually come back to the thick blue TL and then one of the M5 candles close above blue TL right at 1.24076: THAT IS REGULAR ENTRY: Let's call it "Entry Type A"
- Instead of waiting for entry A we could also keep cloning the blue trendline lower and lower and enter with better price once a breakout from the cloned TL occurs. On the chart that occurs right at price level: 1.24042.. We can call that entry "Entry B". This is an aggressive type of entry because we force to enter as early as possible.
- If Entry A was still not convincing you to enter or you missed that entry you could have a new chance to enter by cloning a new TL to next swing high and wait for a new breakout from that one. Here it occurs right at price level 1.24045 which is almost same with our aggressive entry B. We can call this sort of entry a Belated Entry or Entry C.
I hope it clarifies what I generally do but I know it doesn't explain everything. This thread or posting itself is not enough to explain everything. This is what I can do for now. But before I finish I want you all to see one important thing: None of the entries A, B or C have been executed while candles were below GREEN 54 LWMA line. That is very crucial!!!!!! Whenever we enter long, price MUST BE above 54 LWMA line on both the H1 and the M5.. Never forget that!
I hope it clarifies.
Stay Green
Attached Image (click to enlarge)
Focus only on what truly matters!
4