WOW so if you can just do that randomly at the wrong time of day and with no logic to the buying / selling... Do you think if you used it with the top/ottom method of which I do, do you think you can win.
I'm getting really annoyed of people on the factory moaning, arguing, saying you can't win... YOU CAN but you have to think differently to a retail trader..
People hate this method because it doesn't have an indicator.... Sorry but it's the truth... Retail traders are lazy and looking for an easy route. It doesn't exist.
Over the last few years the Forex market has mega changed.. More Investment banks, big players, hedge funds are trading Forex. They are all moving to Forex more and in 2020 the Forex market will be worth ten trillion a day..
Anyway its a long weekend here in the U.K with a holiday Monday.... So have a great weekend and learn something new..
You wont make money in Forex with pig patterns... Oh sorry butterfly patterns ;-)
{quote} I took that data as shown on the watchlist and bought/sold based on the percent as a test.. Each + I brought and each - I sold... These are demo trades and will leave it open until just before New York close and post the result... NO Method in the selection but just using the table of the negative correlation pairs.. No tops/bottoms or contrarian. Just random buy and sell. Just see how the negative correlation with each pair works.. DO NOT COPY THESE TRADES. IT IS A TEST. P.S I meant to have 1 lot each but forgot to change it. The trades...
Ignored
Master Neil,
For the test, on which time frame on myfxbook should one use the negative corelation values to get the counter pair?
{quote} Master Neil, For the test, on which time frame on myfxbook should one use the negative corelation values to get the counter pair? Thanks
Ignored
Use the daily only... I only trade the daily but use the H1 as a counter trade.. Just like the GBPJPY today. It was a few thousand up then it hit the top on the H1 and came down and the test trade ended up with a loss.. If that was a real trade and not testing them to show you here, I would of closed the trade and opened it again if and when the GBP/JPY hit the bottom.
WOW so if you can just do that randomly at the wrong time of day and with no logic to the buying / selling... Do you think if you used it with the top/ottom method of which I do, do you think you can win. I'm getting really annoyed of people on the factory moaning, arguing, saying you can't win... YOU CAN but you have to think differently to a retail trader.. People hate this method because it doesn't have an indicator.... Sorry but it's the truth... Retail traders are lazy and looking for an easy route. It doesn't exist. Over the last few years...
Ignored
Master Neil,
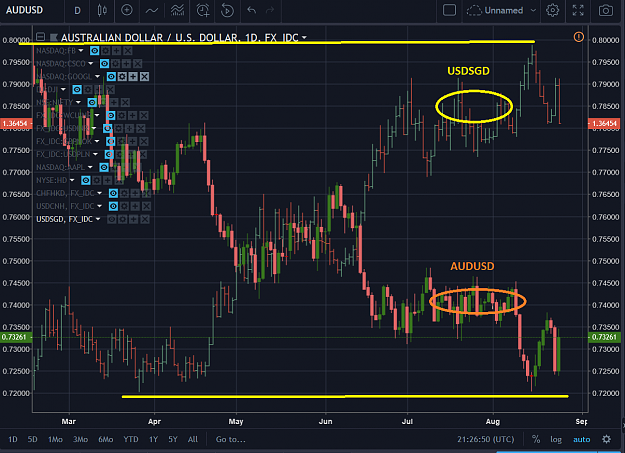
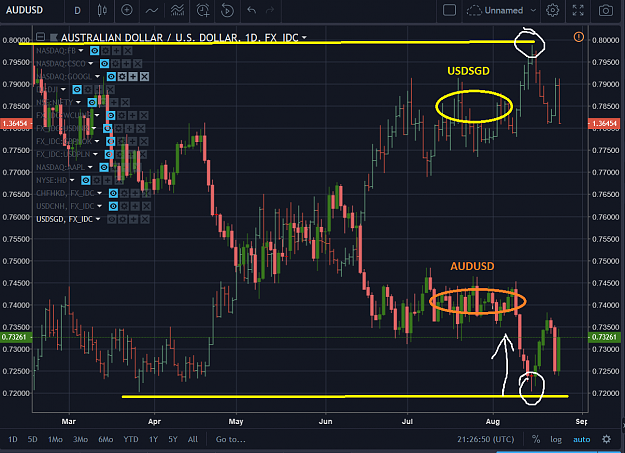
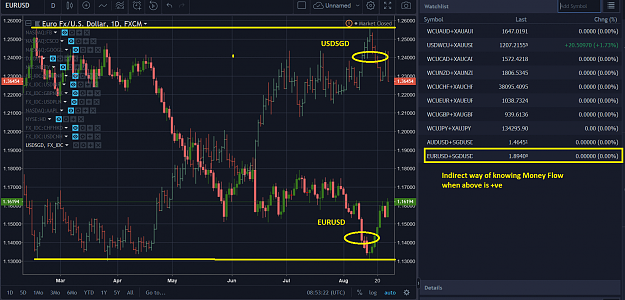
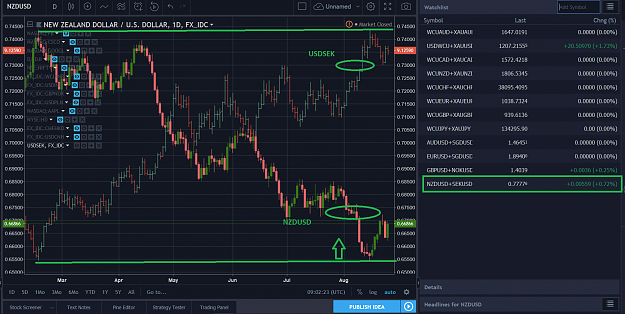
The below is AUDUSD vs USDSGD {negative co related of AUDUSD based on Daily TF} and seem to have hit the top and bottom at the same time.
In addition to this, can one use Money Flow to provide any insight/confirmation? If so, how is it done?
Went through the money flow posts, but having a tough time wrapping my head around the role of gold.
{quote} Master Neil, The below is AUDUSD vs USDSGD {negative co related of AUDUSD based on Daily TF} and seem to have hit the top and bottom at the same time. In addition to this, can one use Money Flow to provide any insight/confirmation? If so, how is it done? Went through the money flow posts, but having a tough time wrapping my head around the role of gold. {image} Thanks {image}
Ignored
You have to read money flow... See where the money is going... As in the test trades... AUDUSD was rising and the USDSGD was falling so (in theory) the AUDUSD will rise a lot. And as it hit the floor (AUDUSD) it has a high chance of rising... As the the USDSGD hit the roof at the same time, in theory the AUDUSD will mega rise..
It does take some getting used to.... If you have time over the weekend do some charts in tradingview or MT4 and just see where some hit the floor/ roof and try to see the money flow.
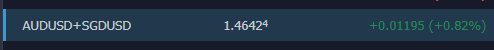
You can keep trading them a a daily basis ut they must have money flow or just use the correlation like you have for the top/bottom chart and in the marketview just look at the percent... If it is rising like today for the AUD/USD you would of brought it around the +0.15/0.20% mark as you would of know there as money going in to them and not a lot into the USD.
Neil what is the entry signal for a trade when it hits top or bottom? There is a chance they it can go all the way up or down.
And are lower time frames like H1 and H4 also reliable?
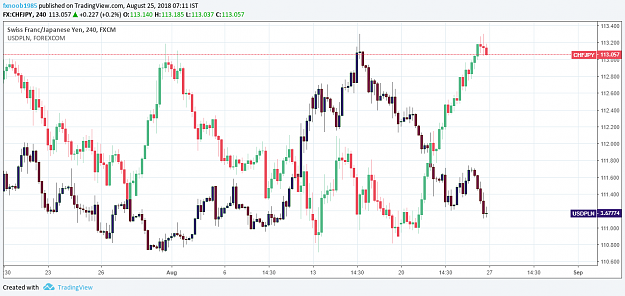
And is this trade solid chfjpy hot the top on h4?
And one more thing. When we open the TA chat , the tops and bottoms change .
Attached Image (click to enlarge)
this is what i am talking about. i followed that trade of yours. but with the chat open and close, there is a different chart.
Attached Image (click to enlarge)
Attached Image (click to enlarge)
Forex is a wild wild beast. You cannot tame it. Just run wild with it.
Neil what is the entry signal for a trade when it hits top or bottom? There is a chance they it can go all the way up or down. And are lower time frames like H1 and H4 also reliable? And is this trade solid chfjpy hot the top on h4? And one more thing. When we open the TA chat , the tops and bottoms change . {image} this is what i am talking about. i followed that trade of yours. but with the chat open and close, there is a different chart. {image} {image}
Ignored
You must be doing something wrong.. If your having trouble with tradingview use MT4 and the overlay chart indi posted earlier in the thread.
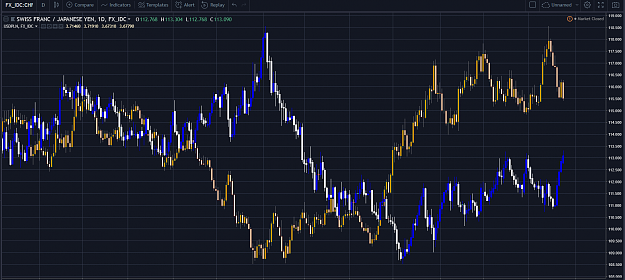
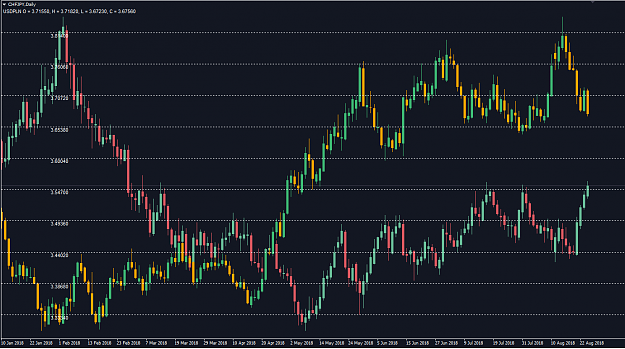
I take it the trade was USDJPY. It's 04.30 so fried brain.
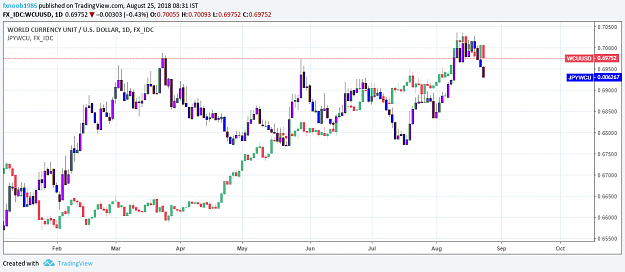
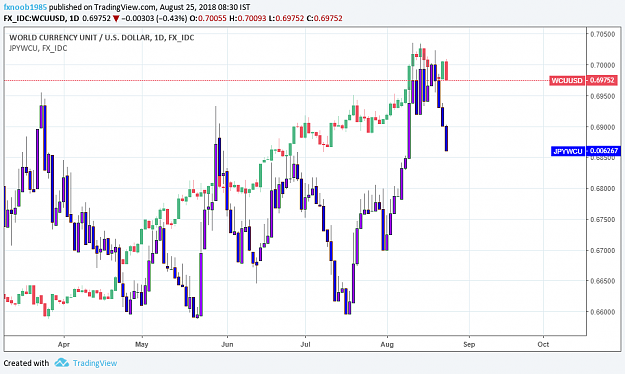
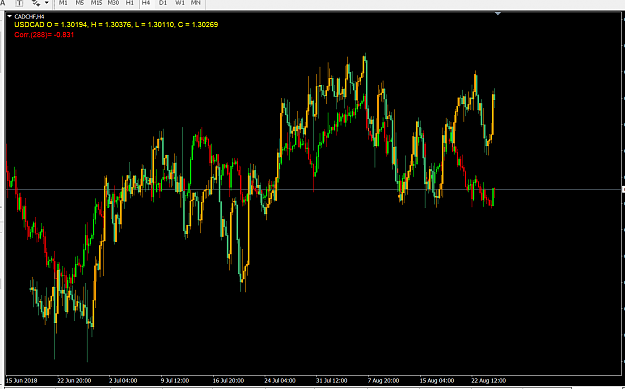
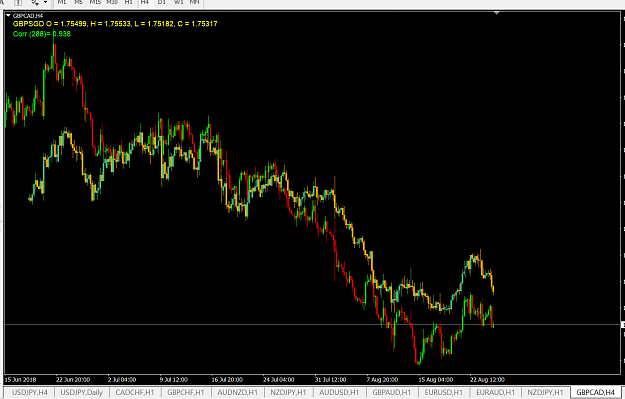
Here is a CHFJPY chart for tradingview on the H1 and daily and from MT4 H1 and daily... The candles don't change and we only look back 200 candles..
{quote} You must be doing something wrong.. If your having trouble with tradingview use MT4 and the overlay chart indi posted earlier in the thread. I take it the trade was USDJPY. It's 04.30 so fried brain. Here is a CHFJPY chart for tradingview on the H1 and daily and from MT4 H1 and daily... The candles don't change and we only look back 200 candles.. {image} {image} {image} {image}
Ignored
Thank you for replying. So the chfjpy hit the top on H1. So, can we assume it might go down or should we just look at the daily?
Forex is a wild wild beast. You cannot tame it. Just run wild with it.
{quote} You have to read money flow... See where the money is going... As in the test trades... AUDUSD was rising and the USDSGD was falling so (in theory) the AUDUSD will rise a lot. And as it hit the floor (AUDUSD) it has a high chance of rising... As the the USDSGD hit the roof at the same time, in theory the AUDUSD will mega rise.. It does take some getting used to.... If you have time over the weekend do some charts in tradingview or MT4 and just see where some hit the floor/ roof and try to see the money flow. You can keep trading them a a...
Ignored
Master Neil,
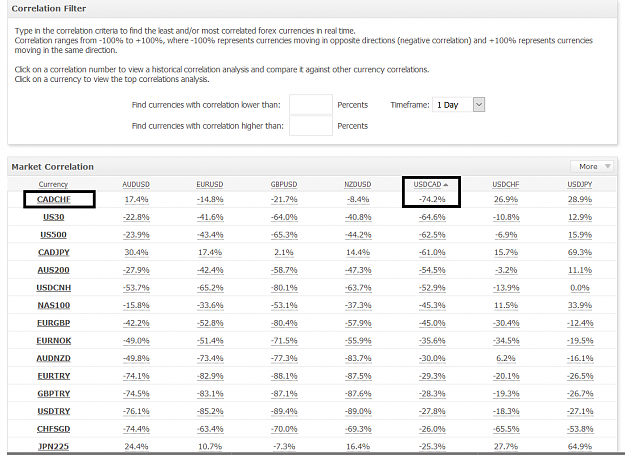
Thanks for the detailed explanation. I have taken negative corelation on Daily TF for the following USD pairs:
Attached Image (click to enlarge)
Attached Image (click to enlarge)
Attached Image (click to enlarge)
In all of the three
EURUSD-USDSGD
GBPUSD-USDNOK
NZDUSD-USDSEK
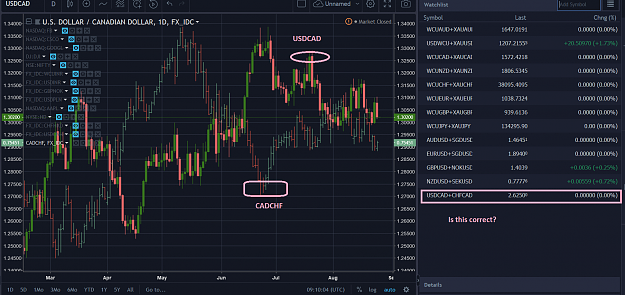
the negative correlated pairs had USD. Now coming to USDCAD, it's negative correlated pair is CADCHF
Attached Image (click to enlarge)
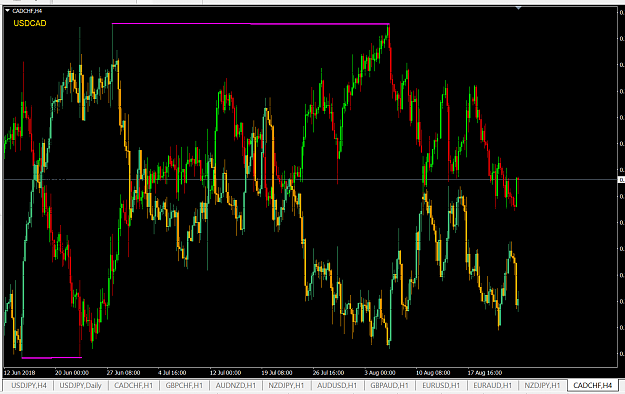
Is it alright even if the negative corelated pair does not contain USD? Extending the above logic, to see the moneyflow, is this correct way of clubbing USDCAD+CHFCAD?
Attached Image (click to enlarge)
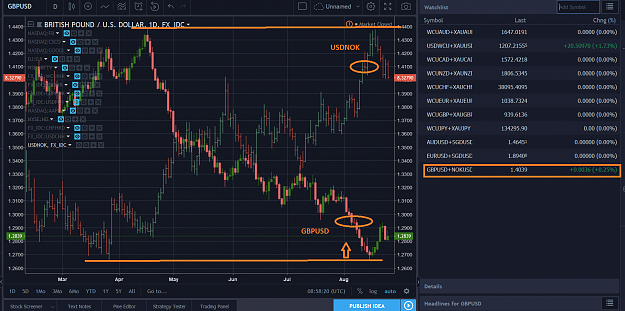
Also, just want to confirm, on the negative correlated trade of GBPUSD vs USDNOK, if we want to use the default method of money flow {instead of GBPUSD+NOKUSD on the watchlist} , we look for:
{WCUGBP+XAUGBP} becoming negative while {USDWCU+XAUUSD} becoming positive?
sorry may i ask? But the negative correlation has translated in percentage right? so stronger the negative correlation better is? because CHFJPY - USDPLN got -61% negative correlation and it has been a big buy but the percentage has been lower than other.
once the negatively correlated pairs reached roof/bottom, how are we going to enter the trade? What tf to look for reversal? Using rsi method? Or look for the shift in currency strength? And how are we going to set sl?
{quote} Master Neil, Thanks for the detailed explanation. I have taken negative corelation on Daily TF for the following USD pairs: {image} {image} {image} In all of the three EURUSD-USDSGD GBPUSD-USDNOK NZDUSD-USDSEK the negative correlated pairs had USD. Now coming to USDCAD, it's negative correlated pair is CADCHF {image} Is it alright even if the negative corelated pair does not contain USD? Extending the above logic, to see the moneyflow, is this correct way of clubbing USDCAD+CHFCAD? {image} Also, just want to confirm, on the negative correlated...
Ignored
"Also, just want to confirm, on the negative correlated trade of GBPUSD vs USDNOK, if we want to use the default method of money flow {instead of GBPUSD+NOKUSD on the watchlist} , we look for:
{WCUGBP+XAUGBP} becoming negative while {USDWCU+XAUUSD} becoming positive?"
This inexactly what I thought about looking for next week at market open Aaven.
I have a question once the negatively correlated pairs reached roof/bottom, how are we going to enter the trade? What tf to look for reversal? Using rsi method? Or look for the shift in currency strength? And how are we going to set sl?
Ignored
Hello Zak,
ill take a stab at answering this question until Neil provides clarity.
Using Aaven's example above.
Lets say the following scenario plays out.
GBPUSD+NOKUSD= -1.20% (this means the GBPUSD is very weak and setting up for Buy)
My next step would to monitor WCUGBP+XAUGB+ (Based on the scenario above the percentage will also be green meaning weak GBP)
I will be monitoring 1st: GBPUSD. for +.20 or greater.
2nd: looking for WCUGBP+XAUGBP to be -/red.
3rd: GBPUSD+NOKUSD to be +/ green
Will look at 1hr tv charts for tops/bottom reversal...
Any advise on this approach will be appreciated Neil.
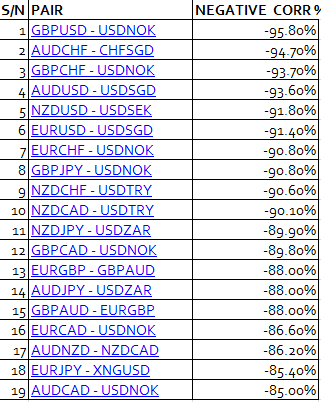
sorry may i ask? But the negative correlation has translated in percentage right? so stronger the negative correlation better is? because CHFJPY - USDPLN got -61% negative correlation and it has been a big buy but the percentage has been lower than other.
Ignored
I think that's true, the stronger the negative correlation the better. I think Neil could advise of a minimum cut off percentage to consider it as a pair.
You will only profit from all of this Niel is sharing if you study study study. I have used a cut off of 80% for the negative correlation 19 qualified out of 28 pairs, see below the ranking, the higher the better for correlation, if you want the excel PM me. Put all of this in the watchlist on trading view following the nomenclature advised by Niel and observe the movement for a day at start/mid session or take snapshots at intervals, then you will see the light . Some are setting up nicely for next week, you can share and I will confirm if you are right, I only picked top 11 to monitor.
Safe pips
Attached Image
D labour of a fool wearieth him cos he doesn't know how to enta d city
Some remarks from my side.
I see some discussion about overlay charts and correlation.
The overlay charting is just a calculation between two pairs by
matching the minimum and maximum of the two pairs over a certain period.
This is just done by shifting the two pairs based on max/min values of the two pairs to each other and some resizing of bars/pips, needed for 5 and 3 digit pairs.
If for one of the pairs in the bars to come the max/min value over the calculated period of one pair will change,
than the shift will change and also the charting. As simple as that.
So they look nice, but have limited value.
Attached Image (click to enlarge)
If a set of pairs in the charting have a high positive or high negative correlation coefficient
than the pairs look strong mirrored.
I recoded the overlay indicator based on correlation formula. To me this makes more sense.
Then we see how two pairs behave w.r.t. to each other.
Correlation coefficient can be max 1.0 and minimum -1.0.
For positive correlation you must set the mirror parameter to true in the overlay indicator.
Highly positive correlated pairs have the same behavior, pair A goes up, pair B goes up.
Pair A goes down, pair B goes down.
For highly negative correlation the opposite is true, pair A up, pair B down.
But sometimes they don't follow the "rules". Due to whatever reason(red news??, a politician says something stupid ??).
But after a while the pairs will find each other again.
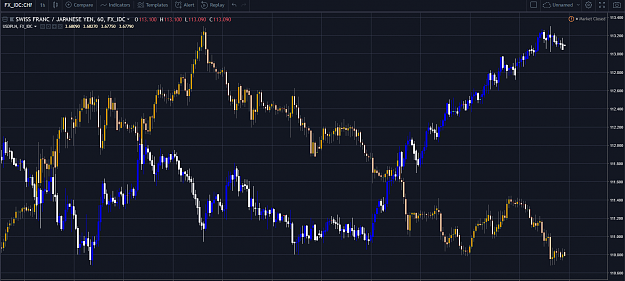
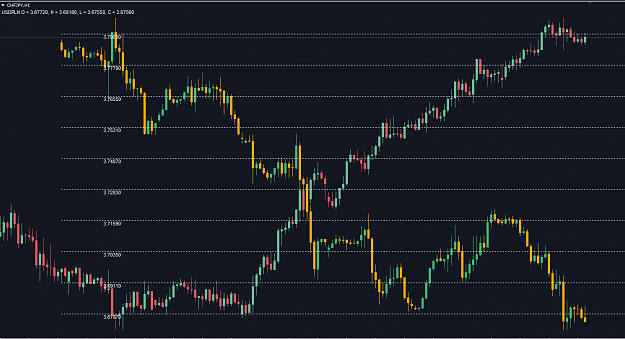
See the chart below.
Attached Image (click to enlarge)
In this chart we see the two pairs twisting around each other, sometimes widening, narrowing or even crossing.
We need widening and then we can enter.
But also here the charting is based on the calculated period of time and the two pairs can change w.r.t. to each other as time goes on.
But much less, certainly if you take a longer period like 3/6 months.
The last chart is an example of negative correlation, but it works of course also for positive correlation.
Attached Image (click to enlarge)
BR
It is not important how often you fall down, but how often you get up again
{quote} You must be doing something wrong.. If your having trouble with tradingview use MT4 and the overlay chart indi posted earlier in the thread. I take it the trade was USDJPY. It's 04.30 so fried brain. Here is a CHFJPY chart for tradingview on the H1 and daily and from MT4 H1 and daily... The candles don't change and we only look back 200 candles.. {image} {image} {image} {image}
Ignored
Hi Neil,
Sorry for bothering you sir. Can we use the negative correlation strategy and trade straight out of the 1 hour chart without reference to the daily chart for the ceiling and floor.
What I mean is if on the 1 hour chart the negatively correlated pairs hit the ceiling and the floor respectively can I venture to take a trade without referring to the daily chart to see if the pairs have hit the ceiling and the floor respectively.
Neil, the weekend is usually a time where I look back all the infos I got during the week. I decided to take a look at the Dennis way and I was wondering what it would happen if I switch the days to 50...here the results:
Friday close, weak above, strong below.
200 50
GBP GBP
AUD JPY
NZD USD