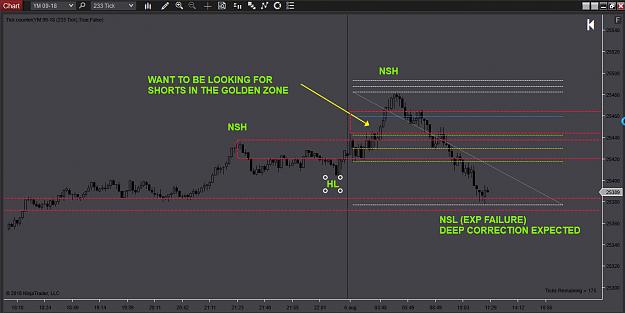
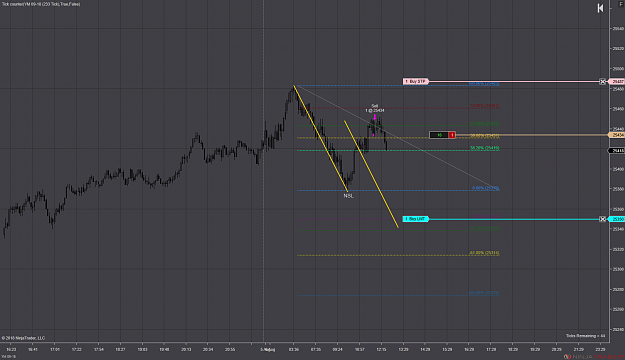
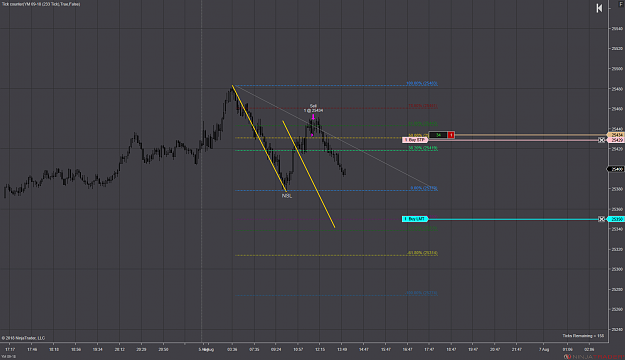
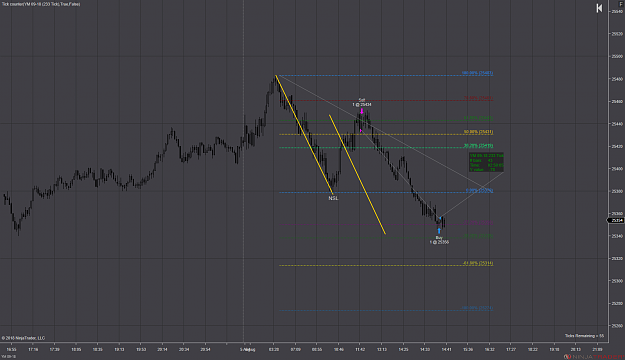
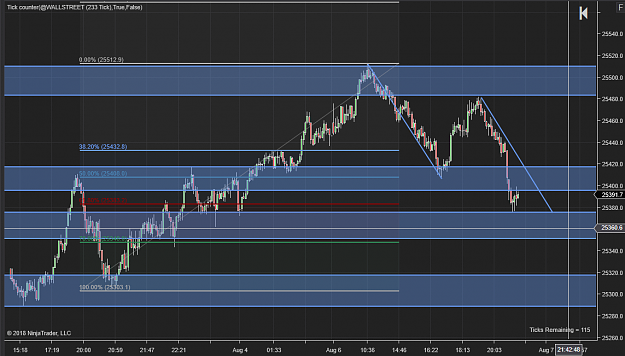
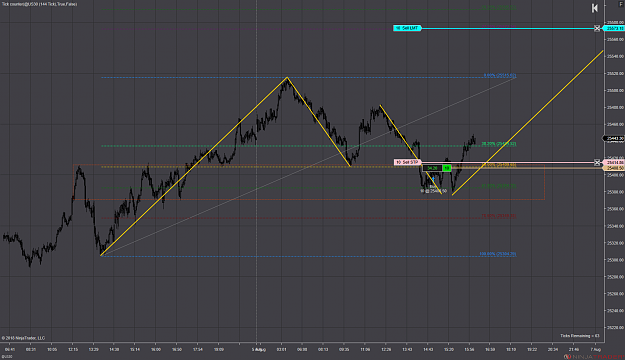
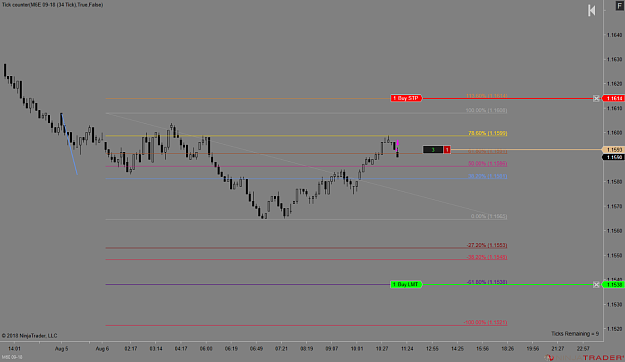
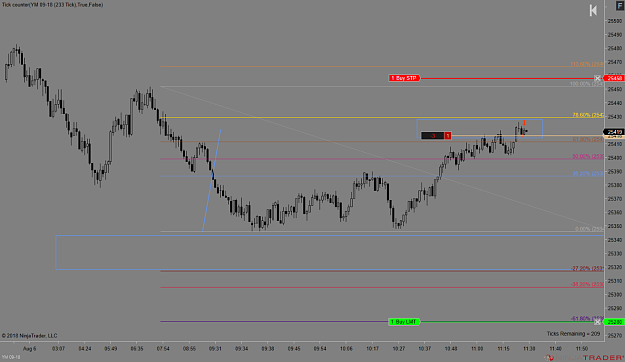
{quote} Hi Bruin813. I see the pre-open market the same way and placed a sell trade between the 61.8 & 50.0. Entry: 25434 Target: 25350 Stop: 25487 Presently +34. Moved to Break Even +5. Took profit @ 25356 +78 pips. {image} {image} {image}
Ignored
Hi Pete,
Nice one. I missed it, because I wanted price to correct a little deeper.
Did you enter on the rotation candle or did you place a limit order?
{quote} Hi Pete, Nice one. I missed it, because I wanted price to correct a little deeper. Did you enter on the rotation candle or did you place a limit order?
Ignored
I got in the trade the moment the rotation candle finished rather than through a limit order. On the exit I saw a lot of volatility and noted that the price hit the target which I moved on so that I could trail it. In the end I exited a few pips away from the target but am happy with the trade overall.
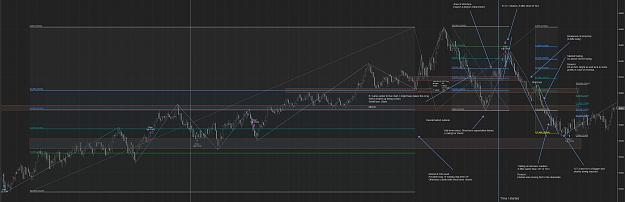
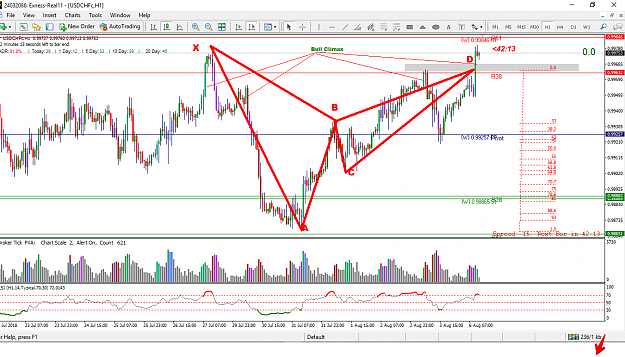
Took almost the same trade as PeteH it seems What do you think of my thought process and analysis? Any mistakes that stand out to you? I know it's a hard question, because this was a winning trade. But the worst thing is making mistakes and getting rewarded for them. Don't mind the ZigZag. It'S just there for visual aid. Testing some things out. {image}
Ignored
I'm still learning myself but your comments on the diagram were similar to my thought processes.
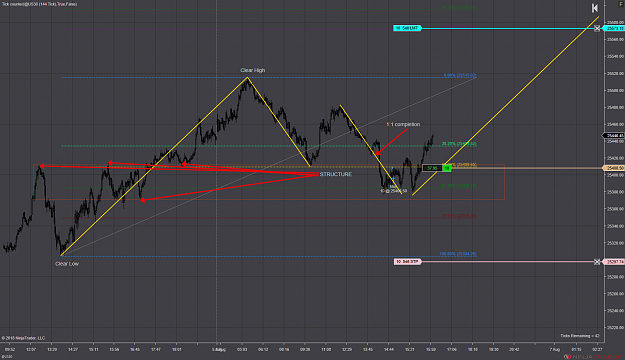
In respect to your sell trade ABCD pattern I looked at the 1:1 completion into the longer term hitting the 61 fib so I am looking for longs rather than shorts. It looks a bit of a period of volatility at the moment though.
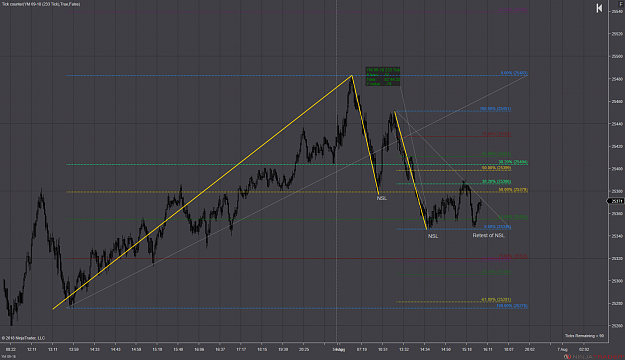
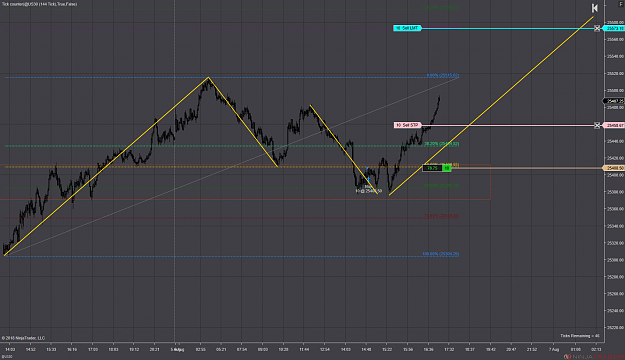
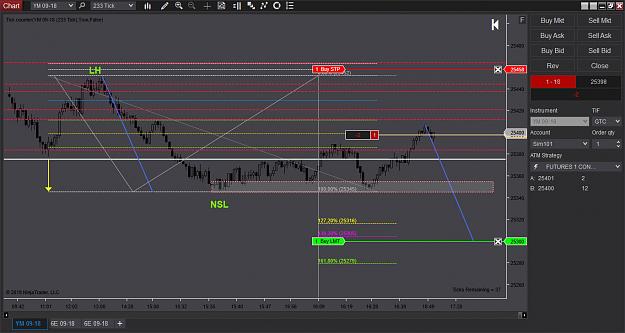
My take on the YM. (trading the CFD version from my broker) Looking for longs at the 25360 area. looking for absorption before i enter. did not that the rotation at the 1:1 completion due to the strong bear bars preceding it. wait and see. {image}
Ignored
I spotted the same longer term 60 fib.
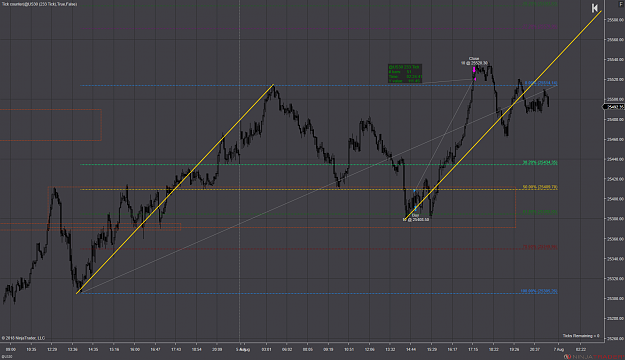
I could not afford the stop on my YM (Futures account) but placed trade on my CFD account (@US30). I was in a little later than I wanted at 25408.5 but as it is a longer term style trade I was o.k. with it as the R:R was alright (below the 50 fib).
Entry: 25408.5
Stop: 25297.74
Target: 25573.18
Moved to BE+5
Moved to BE+50
Closed trade early at +111 pips when I saw a significant slow down in the momentum upwards.
Total today +111 & +78 = +189. Best result for a long time.
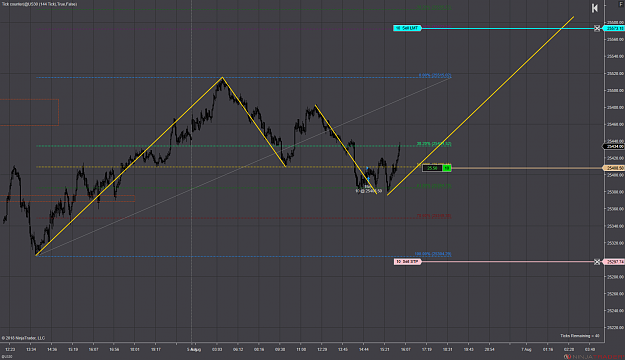
{quote} I'm still learning myself but your comments on the diagram were similar to my thought processes. In respect to your sell trade ABCD pattern I looked at the 1:1 completion into the longer term hitting the 61 fib so I am looking for longs rather than shorts. It looks a bit of a period of volatility at the moment though. {image}
Ignored
I also went long at 25436, it's a bad entry but i consider the sentiment continuously bullish from last friday. As Pete mentioned, 1:1 completion hits 61,8 of the big swing.
I'm still fighting with interpreting good rotations, as i don't have 233 tick charts. only 100, 150, 200 etc.. vs 1 min / 2 min
{quote} Your analysis looks solid. Do you draw the longer term S/D levels from the 1597T chart? Can you explain your 2nd entry with a chart? I'm not sure if I understand. Thanks.
Ignored
I looked simply at the US30 t144 chart for the entries. I look for the most obvious highs and lows and drew my lines and fib's using these. When I spot a 1:1 completion to a 61 fib I like these entries as they have two positive signals. Firstly the 61 fib (golden ratio) on longer term and secondly the 1:1 exhaustion. I also noted the structure to the left so in my mind a very positive trade to take based on the signals.
{quote} Your analysis looks solid. Do you draw the longer term S/D levels from the 1597T chart? Can you explain your 2nd entry with a chart? I'm not sure if I understand. Thanks.
Ignored
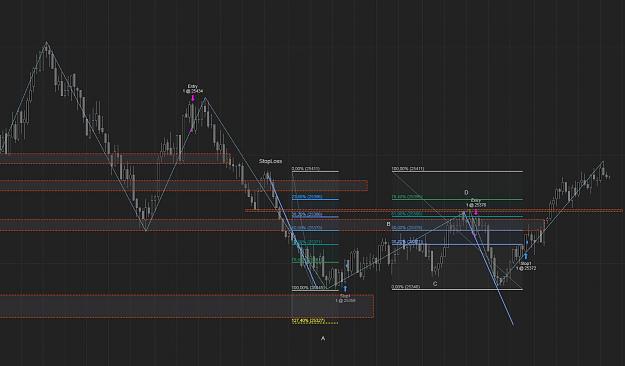
Not much to it. But here is a picture. Trade ended up at BE. As I said before. Mid-term Fibo level for longs. So taking the short goes against the mid-term OF, but it was still in line with the intraday OF. For me it was worth the risk-reward, only because I had enough room to protect it until it got to my AoI or the last low. My thought was that price might complete the 1to1, which would end up somewhat in my AoI.
And no, I don't draw S/D zones from the 1597T right now. I just look what's left from the previous days.
Didn't want to complicate things, since I only trade the more intraday/immediate OF.
But usually I am the person who looks at multiple timeframes. On my forex account I look at the 4hour, 30min, 5min and tickchart for swings and S/D zones.
{quote} I looked simply at the US30 t144 chart for the entries. I look for the most obvious highs and lows and drew my lines and fib's using these. When I spot a 1:1 completion to a 61 fib I like these entries as they have two positive signals. Firstly the 61 fib (golden ratio) on longer term and secondly the 1:1 exhaustion. I also noted the structure to the left so in my mind a very positive trade to take based on the signals. Edit: I attach a chart to show my thinking. {image}
Ignored
Exactly my thoughts as well. I didn't take that one, simply because I'm trying to see what my intraday expectancy is. So I don't take longer term trades. But I would have taken that one as well.