Just some fun on daily chart. It works everywhere. But you would need to wait longer time than on H1 chart. If someone does not understand what high or low we take from the indicator, ask me. We take low of the indi as support / high of the indi as resistance. Just like with normal price. 
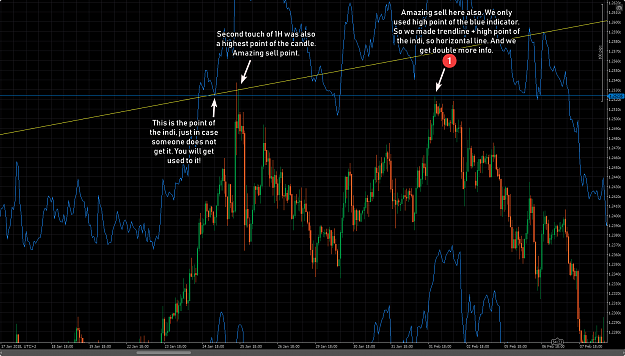
You can draw those as you wish. You will always get a point somewhere to trade. I can create even 5 of them. IT is quite messy, but you will have great idea what to expect.
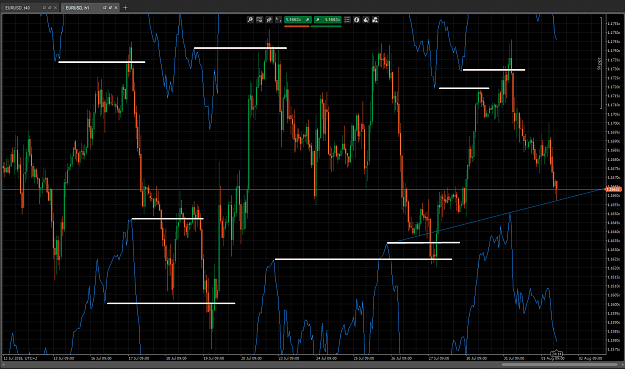
On the second chart, H1 chart was used! Lower ticks like 30-50 are not in such old history. Also remember that when you go for daily chart, you will need to check the H1 also! Then you can go for tick chart.
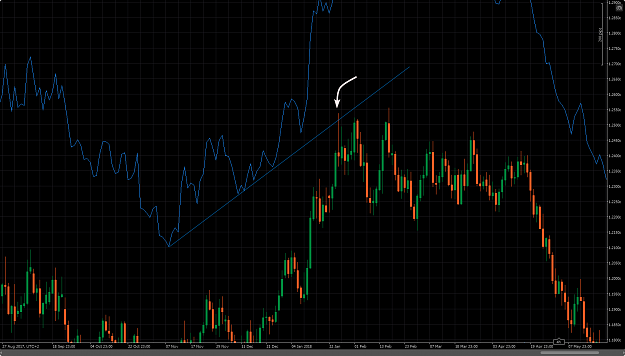
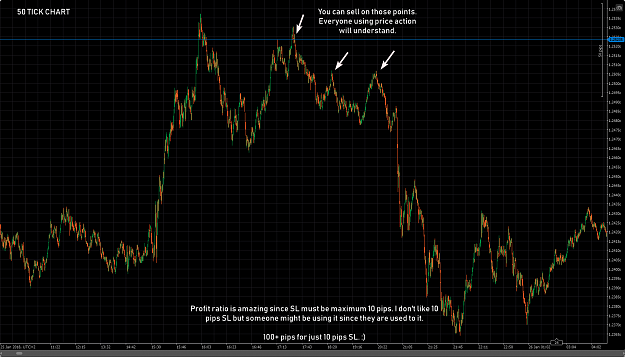
Third chart here is 50 tick chart. I managed to get it. cTrader was updated and we can get more ticks in history. Which is always a plus!
You can draw those as you wish. You will always get a point somewhere to trade. I can create even 5 of them. IT is quite messy, but you will have great idea what to expect.
On the second chart, H1 chart was used! Lower ticks like 30-50 are not in such old history. Also remember that when you go for daily chart, you will need to check the H1 also! Then you can go for tick chart.
Third chart here is 50 tick chart.
Attached Image(s) (click to enlarge)
1