Here are new ideas I had.
Post 1 - https://www.forexfactory.com/thread/...6#post14127956
Post 2 - https://www.forexfactory.com/thread/...0#post14127980 (My favourite, even tho it does not plot signals like crazy...
Hi everyone, this what I'm willing to show you is something I made years ago. It will also be something like my own diary, because I tend to break my own rules. Which is bad of course. So, what you will find in this thread? // Please, thread is constantly updated because I cannot remember everything what I want to show you in 10 minutes. Keep this in mind and check it regularly, Thank You.
\\ Updated for the indicator (cTrader version.. My own old version, I will make new one later but it is not needed right now) //
- You will understand why trading ticks is much better than using any minute/hourly chart
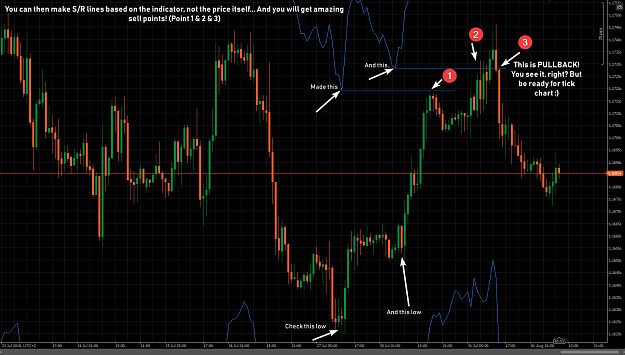
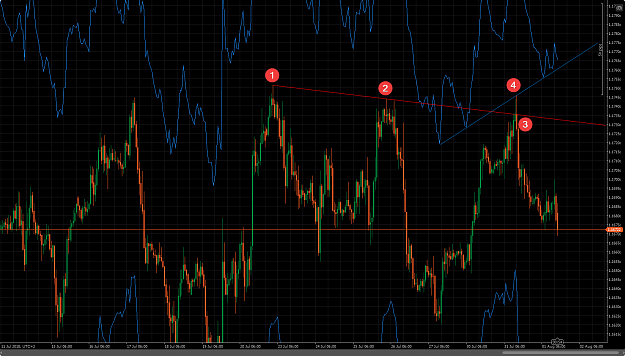
- Different way to place S/R lines & Trend Lines (Only showcase, for now.. )
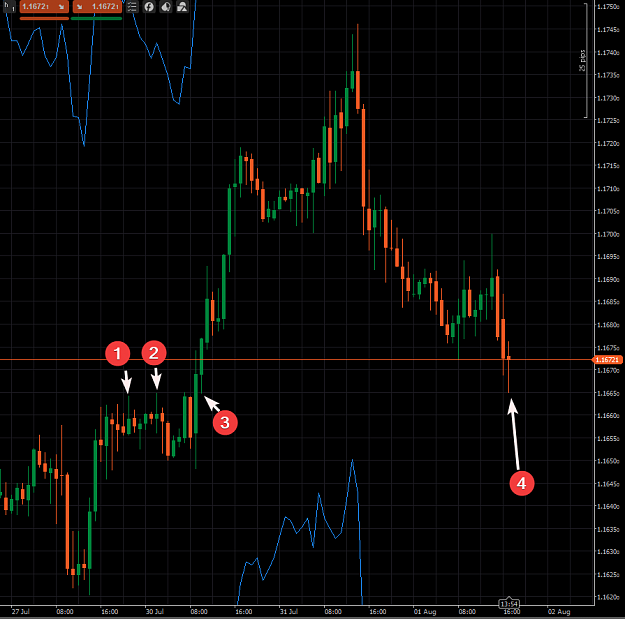
- You will learn how to make powerful resistance or support just by using two or three candles!
There is much more to show you.. I'm so happy with everything, because everything is amazing and nobody use it. Because no one see ![]() .. If you understand.. I will show you this for now. I can't even show you everything, possibilities are endless.
.. If you understand.. I will show you this for now. I can't even show you everything, possibilities are endless.
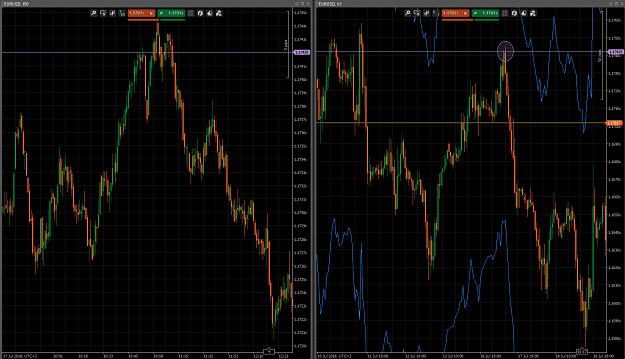
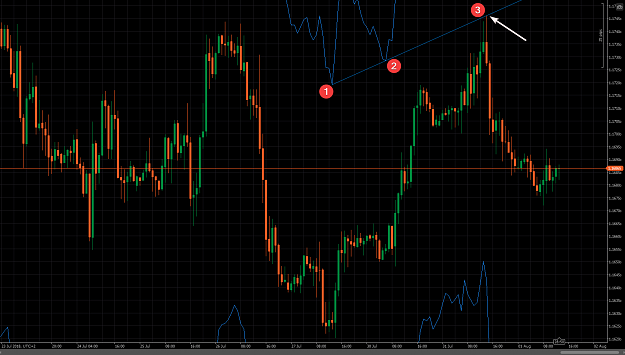
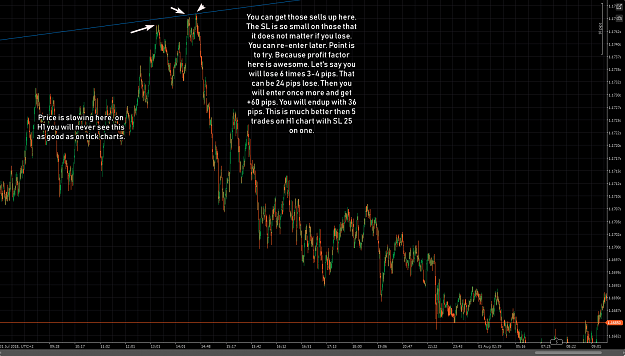
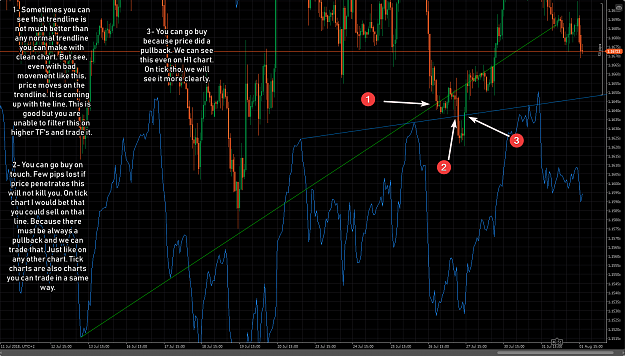
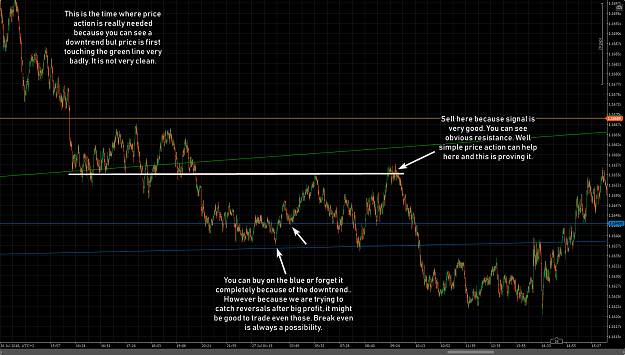
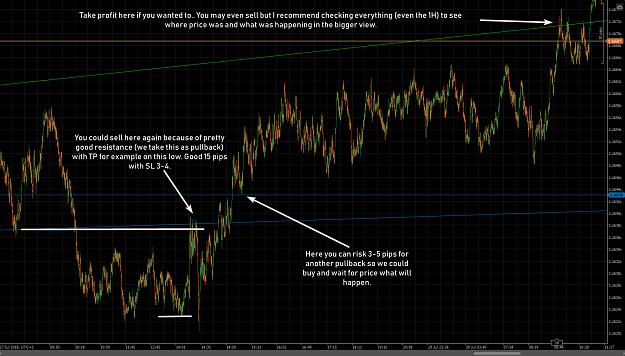
Let's see simple resistance... 1H chart vs 50 tick charts. Don't mind the blue indicator below & above price. I will explain this later on. You will be amazed what this thing can do. ![]()
I must apologize guys, let me please end this now, because of my PC problems and less time. I will continue this thread with new posts. This is not some one time thing, this will take time. And you will understand.
On the chart below, check how you can trade the left chart (50 tick) vs right chart where only 1H chart is used. You cannot see a reversal, but on left side, you can! This is main point here you need to understand. And more powerful the move is, less tick chart you need. Even one minute is NOT enough in these cases! To clarify this, to see reversals in NFP move, you need 5 or 10 ticks chart. One minute is not useful here.
I know this is boring so far, but I will start from the beginning here. So you will understand. I can't get to the core, you will be lost. But I promise it will be worth your time ![]()
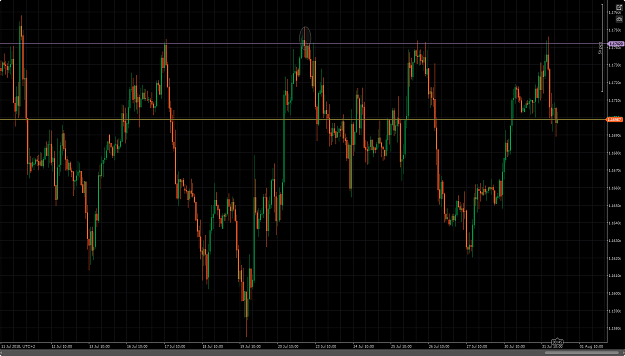
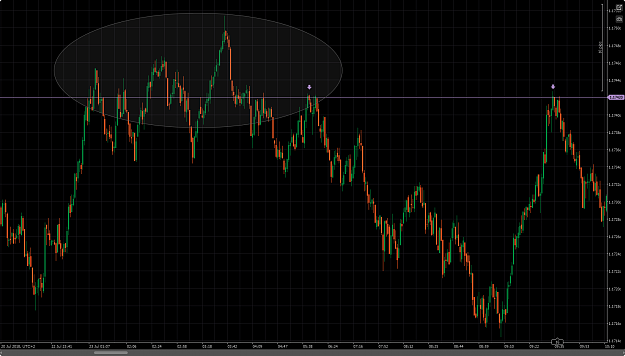
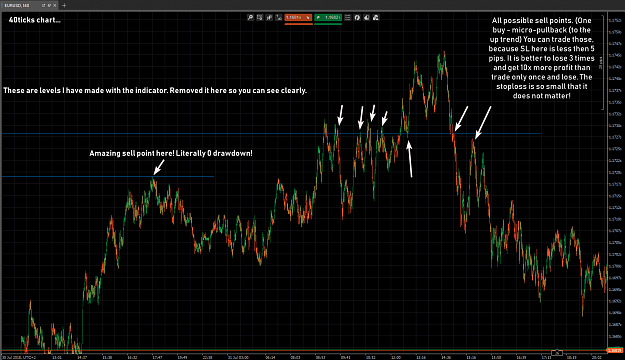
Check the difference on last two charts. You understand? I plotted two arrows just to show you where you can go sell. You can see that price is lazy to beat that level. Even smallest hesitation of the price is useful for us. I will prove this as time goes by..
By the way, this is mostly price action. Well.. It is only price action, to be honest. This blue indicator I will explain later on. And you will be most probably blasted by things you can do with such banal thing.
Useful posts:
https://www.forexfactory.com/showthr...0#post11456310
