Disliked{quote} Some questions I must ask are as follows: Under what conditions do you decide to go long or short off the Murrey chart you posted? On an ideal longer term setup off this posted Murrey chart where would your likely entry be, where would your Stop be placed and where would your longer term target be placed? For example, certain levels or the candlestick colors and formations or a deeper fundamental bias. What about entries via intersecting lines, horizontal with vertical or horizontal with angled or angled with vertical. Masterrmind.............Ignored
I will let you read this and see the charts then come back with any questions and i will carry on.
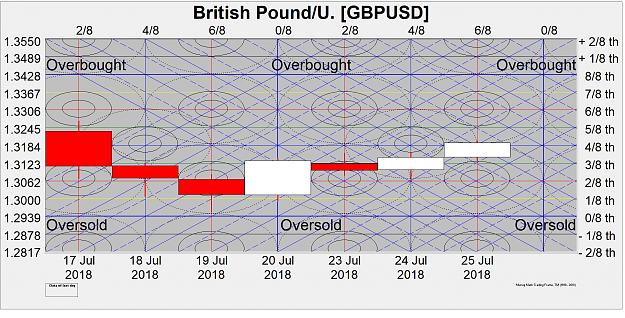
PS when we see say a 4 8 16 32 etc giving us the same OB/OS level to me its like a set of m/averages all meeting so its important ie if they break we have a chart shift, We can add range into it eg how much range would you expect in say 4 8 16 days etc etc well we have an idea with our zones
Attached Image(s) (click to enlarge)


1