{quote} Not Sure bro. Even i am grappling and testing various options on trading view charts. That option did help me a bit. So wanted to run by you...
Very informative posts fellas- will place contrarian trades tonight with the support of WCU and test 1hr + time frames and post results.
Can use WCU with suppply/demand levels to check exhaustion or continuation to support our trades.
Are the WCU charts 'live', meaning updated every few seconds (i assume so), or at certain time frames.
It would be optimal to find levels (round area numbers) or % that wcu tend to stall out before heading back opposite way.
I understand how KingMark is using WCU charts now, He is getting on trades after they cross from each other, I think what were doing is different, were looking for WCU currencies to reach overbought and oversold levels and diverge from each other on each side to get the best moves.
I understand how KingMark is using WCU charts now, He is getting on trades after they cross from each other, I think what were doing is different, were looking for WCU currencies to reach overbought and oversold levels and diverge from each other on each side to get the best moves.
Ignored
your right
Im trying to combine both methods into one too.
My concern can we really know if it reached an extreme on either upper or lower?
{quote} At this point I'm still not sure what I'm doing, if I'm correct or not, but my confidence in this is growing. Seems to me WCU charts are a very god predictor of what currencies are strong/weak. Problem is I need a concrete method to analyse this with excel and maybe see some things worth looking into. May I ask what that strength indicator?
Ignored
not the best, but does not burden the computer processor.is not WCU!
{quote} your right Im trying to combine both methods into one too. My concern can we really know if it reached an extreme on either upper or lower? I dont know if we can really know this .
Ignored
We cant, otherwise we would all be super rich just a good educated guess.
{quote} We cant, otherwise we would all be super rich just a good educated guess.
Ignored
I think the best way to do this is get the data for say daily chart of the WCU for the open close high low and put it in excel and see if we can calculate the volatility and probabilities..etc of when it might turn and when is an extreme zone. Problem is Tradingview is the only site that provide these charts and you cant get the data from them.
{quote} ONLY at optional levels. I watch CME. on the market since 1996. I work only on the strength of currencies and volumes. but this is another topic {image}
Sorry not got any time to go through every thing as away from home.... If your having trouble with the line charts try it another way with a candle chart.... I will read though the new posts later..
For the JPY WCU strength
GBPJPY+EURJPY+CHFJPY+CADJPY+USDJPY+AUDJPY+MXNJPY+CNYJPY+KRWJPY+CNYJPY - Edit: I'll edit that when charged battery. Added CNY twice.
Example for GBP strength/weakness
GBPUSD+GBPEUR+GBPCHF+GBPJPY+GBPCAD+GBPMXN+GBPCNY+GBPKRW+GBPCNY+GBPAUD
Tradingview only allows you to add ten currencies but it's not far off the real WCU strength,
The chart includes the top 10 WCU currencies by GDP;
USA =USD
GERMANY - FRANCE - ITALY - SPAIN - NETHERLANDS = EURO
JAPAN = JPY
U.K = GBP
CANADA = CAD
AUSTRALIA = AUD
MEXICO = MXN
SOUTH KOREA = KRW
SWITZERLAND = CHF
CHINA = CNY
Leaving out the following countries currencies.
BRAZIL
RUSSIA
INDONESIA
INDIA
TURKEY
SAUDI ARABIA
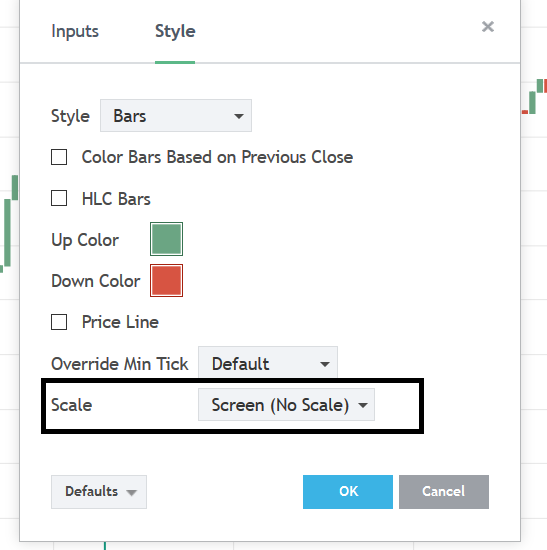
When using the WCU line chart make sure you lock the shift.... Or add them and don't move the chart. DON'T SCROLL... It's a lot different to MT4 charts. The candle chart won't move..
Try adding the other currencies as I'm away at the minute and can't get to a computer as using a tablet and its hard to do.
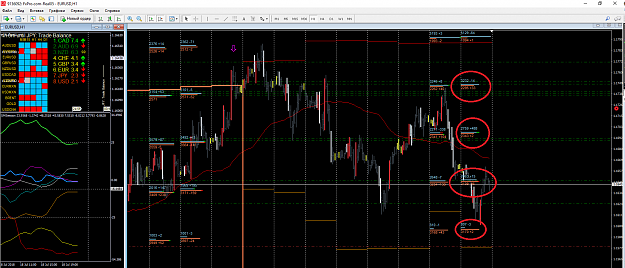
The following chart is the JPY WCU candle daily chart... You can see where it tops and bottoms.. In theory the JPY should get strong now.... It did this morning but lost its power. But if it got it 100% right we would all be billionaires in no time LOL
The white line is the mean price... See how it always returns to it or respects it.. In my opinion and working on that theory, is that is the true fundamental price.
I'll be back and post when I can but keep the trades up and work on the idea with the contrarian method... Try the candle chart on the H1 etc...
Before I left I was working on a tradingview script to show the strength in different time frames but never go round to finishing it. I will when I return.
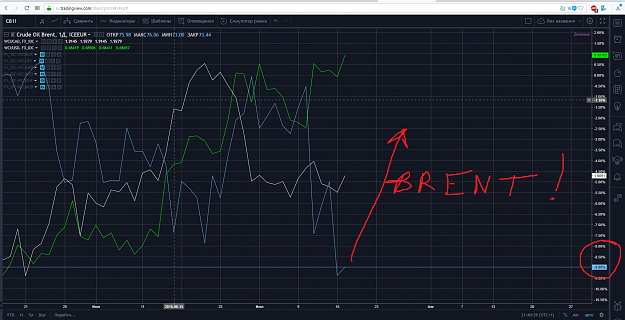
To me when I see the line dropping like the one hefer posted, I see something getting weaker and weaker...why buy it? why assume it will go up? why not sell it and combine it with something getting stronger?
To me when I see the line dropping like the one hefer posted, I see something getting weaker and weaker...why buy it? why assume it will go up? why not sell it and combine it with something getting stronger? Just some questions I need answers to.
Ignored
Because its gone into a buy zone... If you look at the lines they all seem to top and bottom at around the same points... So Brent would be a good buy.