{quote} look at the candles Moty, the price. These were very clear priceaction setups. You should really put your focus on reading candlesticks, not "patterns", not "Indicators", you need to learn what the candles tell you, you really lack very basic knowledge when you don't understand these entries and exits and why these were really good entries and exits based on nothing but price as read in the candles. Remove all that crap from your charts, concentrate on what is important, keep it very simple and take your time. Your results don't matter,...
Ignored
Hi there teek, very interesting on the insights you've been giving. I just started trading are there any good resources or articles you would recommend to understand in depth about the candlesticks like what you said?
{quote} Wouldn't be a bad idea to consult higher tf (4hr and up) and see where we are in momentum run. Then see if the shampoo setup has any potential. Just my 2c. But it's your trade, mate. gl
Ignored
2nd the longer charts , easier to see the bigger support and resistant areas , will kinda direct where to look for scalping patterns in the scrum back and forth, at the very least it should keep you from fiddling in the middle where getting burned is almost a given unless your paying attention . One learns to measure chart patterns like flags and pennants etc that work across all time frames , Probably a better way to spend ones time than posting sheet thts irrelevant because one is sitting in front of a keyboard , Dont just watch price go up and down, its a job , not a pastime lol. You want to get good , practice , practice , practice
{quote} Fundamental Analysis is NOT "watching news". Fundamental Analysts look at charts you never know they existed. A Fundamental Analyst does more charting than anything in order to do the calculations well before "news". There is a vast missconception about "Fundamental Analysis" throughout the industrie. It has nothing to do with "trading the news". NOBODY will teach you this. "and what is least complicated? I want to go to trade something what is easy and make money finnaly" Stop looking for shortcuts. There are no shortcuts. You are in for...
X= 17579
A=1665
B=16494
D=16952.
E should be located from between 1.1621 and 1.1463.
This is not possible,
B should be higher than A and there is no C.
The only possible gartley from the X you say I see possible for now is this one, but that's far away and I won't recommend trading A to B.
Remeber for bearish gartley's, B is higher than A, and should be at least 61.8% retracement of X - A, it also can't touch 78.6%.
{quote} look my freind , do you see any fundamental in this chart ? fundamental news is the fuel of the trend , and nothing more . you want to be Successful trader? It's all in you. Discipline, lack of "big eyes" , risk management and patience {image}
{quote} Hi there teek, very interesting on the insights you've been giving. I just started trading are there any good resources or articles you would recommend to understand in depth about the candlesticks like what you said?
Ignored
yes, I hook you up on material that keeps you busy for the next 10 years or so..
no problem.. PM incoming
edit: for some reason I can not PM you. I think you need to PM me. Feel free to do so anytime
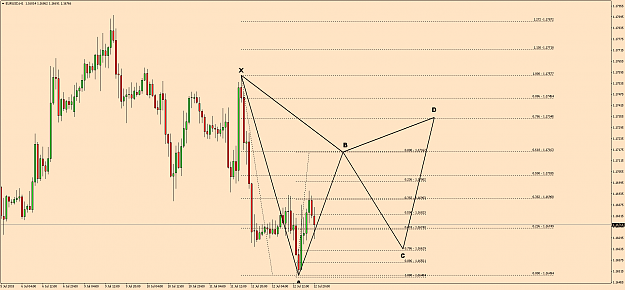
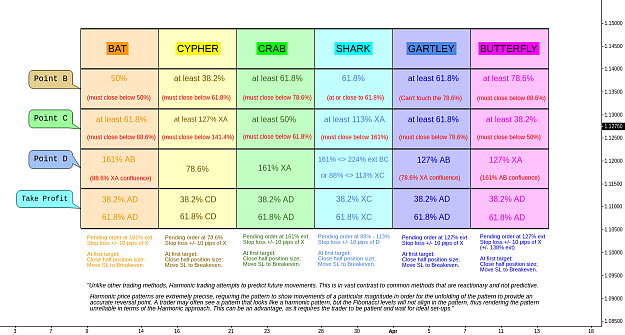
{quote} Ok give me a minute. X= 17579 A=1665 B=16494 D=16952. E should be located from between 1.1621 and 1.1463. This is not possible, B should be higher than A. The only possible gartley from the X you say I see possible for now is this one, but that's far away and I won't recommend trading A to B. Remeber for bearish gartley's, B is higher than A, and should be at least 61.8% retracement of X - A, it also needs to close below 78.6%. {image} Something to get you started {image} Grtz
{quote} Ok give me a minute. X= 17579 A=1665 B=16494 D=16952. E should be located from between 1.1621 and 1.1463. This is not possible, B should be higher than A and there is no C. The only possible gartley from the X you say I see possible for now is this one, but that's far away and I won't recommend trading A to B. Remeber for bearish gartley's, B is higher than A, and should be at least 61.8% retracement of X - A, it also can't touch 78.6%. {image} Something to get you started {image} Grtz
That doesn't matter, we all keep learning. We also keep trading, never give up.
It's hard, really hard.. But not giving up will get you there.
Update
I do have to mention, that when starting trading, harmonics is probably not the best to start with. It's about the last thing I added to my trading tools..
It's probably best to focus on support / resistance and price action first.
Nevertheless, If you start practicing it you'll know when to start looking for patterns, and they will appear everywhere.
Focus on this first, that's the way I would do it.
Level 1 = RISK MANAGEMENT
Level 2 = Price Action / Support and Resistance (Supply&Demand)
Level 3 = Indicators, What they represent & When to use them
The next step is to throw it all into a trading plan, following a routine that is right for you.
Know how to keep losses small, know when to Exit and Enter. And have an overall idea on what to expect next.
It takes time to learn but knowing about all these things only will help.
Nevertheless you can trade with price action and support and resistance alone until the end of days and still be profitable.
The one thing you need to conquer is yourself. Your rules can be as simple as, when an engulfing candle prints on a support level I'll buy and vica versa.
Once you find a routine results will come.
Then it's about backtesting if it works, live demo testing and then starting small with small amount of money. Keeping a journal in the meantime so you'll know about your edge and until what level you can raise your risk.
{quote} yes, I hook you up on material that keeps you busy for the next 10 years or so.. no problem.. PM incoming edit: for some reason I can not PM you. I think you need to PM me. Feel free to do so anytime
Ignored
I tried going to your profile to find a PM button but to no such availability is that normal? I think you can't PM me is due to the age of my account as i just created this haha
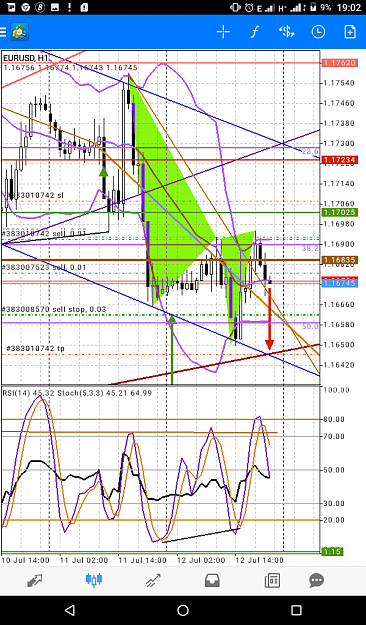
I type I'm the wrong figure. But could this one be right. I only couldn't indicate with Alphabets my locations A,B,C,... BUT is this correct STEF {image}
Ignored
Mate, those trades you have on seem like really good trades. And you have a stop loss too...are you sure you need advice? You seem fine to me.
Joined Jan 2010
|
Status: The Voodoo Boodoo Club
|42,062 Posts
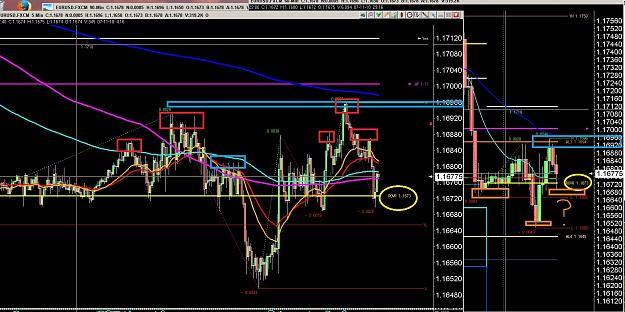
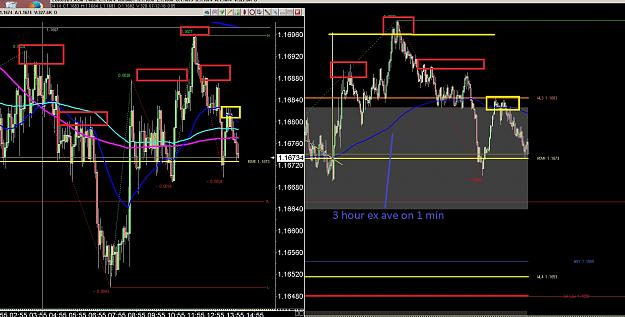
One min chart mentioned a while back , kinda limits the view but good for projections and if you just have to use one ,,,have some stuff on it that can be used , take your 15 - 20 pips at a crack and be done ,, course around the bigger levels you can hold longer ,,,, too hard on the eyes for me but it is a tool . The same things can be seen with a much longer time frame without the eye strain but as stated another tool if your into patterns or can recognize them,, useful at times. Probably not the best tool for beginners to trade with but one can learn a lot about patterns and how support and resistance and price projections works by just watching one and calculating the patterns and price projections out .