{quote} Sorry to disappoint but it's true. Add any level you like and you will get a reaction sometimes. You can't predict price, you can only follow. Thanks for sharing though OP. Edit: but if OP is having success with it for a long time he is probably doing something phenomenal with cutting losses or letting winners ride, maybe you can tell us some more about how you manage your trades?
Ignored
Nice that you are another one if the few that know the ultimate truth. I'm not saying that certain lines are important or not, because I just can't tell..just because certain lines didn't work for me , that doesn't mean there are not people doing great with them. Tell them your ultimate truth, interesting what they got to say
{quote} i have been trading fibo for more than 2 years now -- i know my fibo very well.
Ignored
I tried your method alongside mine the end target is the same. You talk of cycles whilst measuring the amplitude aka price, please explain how you associate the amplitude 4.236 with a time cycle.
Sorry to black cat you but I have been trading 34 years
{quote} I tried your method alongside mine the end target is the same. You talk of cycles whilst measuring the amplitude aka price, please explain how you associate the amplitude 4.236 with a time cycle. Sorry to black cat you but I have been trading 34 years Thanks Nut
Ignored
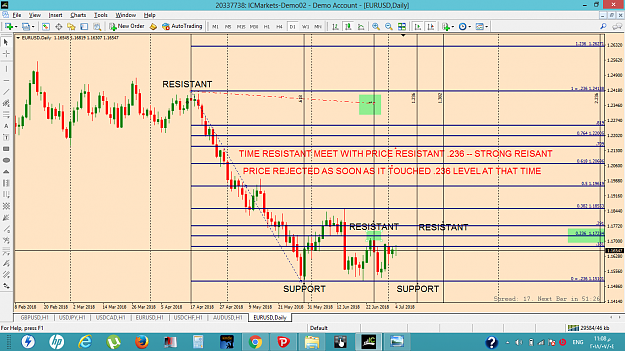
My cycles are price cycles and are not time cycles -- they can complete a full cycle or not -- there are indications that a cycle will cont and others that indicate failure.
I rarely use fib time ret -- i only use it when fib price level meets with fib time level -- this will make a very strong level.
Hey nut, this is a really good contribution. Thank you for sharing your time and experience.
I think the biggest challenge with these forums (as in life) is that the amount of people willing to seriously roll their sleeves up and do the work required is limited.
'in less than half an hour he made over 100 ticks'
I tried your method alongside mine the end target is the same. You talk of cycles whilst measuring the amplitude aka price, please explain how you associate the amplitude 4.236 with a time cycle.
Sorry to black cat you but I have been trading 34 years
Thanks
hey nut can you share fb tool attachmentid mt4 template file pls...
very interest thread keep up your doing well
Thanks to Nut that we are having this highly useful discussion on Fibonacci application. Truly grateful to him for sharing his wisdom not many people do this. Great contribution by him. Thanks again.
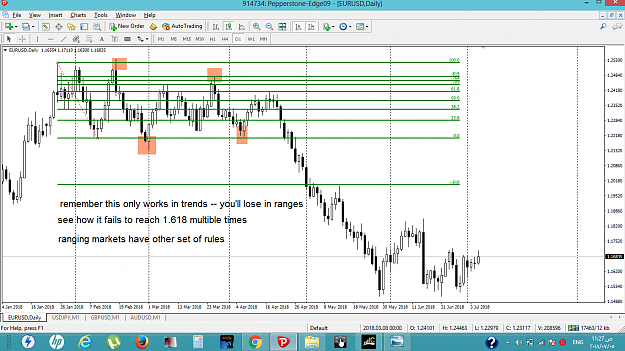
I am seeing the strategy of Nut and observation of raedmaa repeat over an over again. According to Nut's strategy, important levels come out to be 1.618, 2.618, 4.236.....What raedmaa says is that most dominant trends end at 4.236.
Here I am attaching few charts of GPY JPY 4H. I am showing only one of various moves, but if someone studies other pairs they will find almost similar occurrences everywhere. Most trends end at 4.236 levels. Till now I have studied 4H charts. Important thing is to find the right turning point. Charts are almost self explanatory. Also, I think for calculating levels 'closing prices' should be used, but for entries and exits wick can be used.
First chart shows how the complete move ended near 4.236 levels of the initial reversal with just a minor counter trend at 2.618 levels. Second chart shows how when this move ends, the next move also completes around 4.236 levels. Third chart shows after the counter trend is over, how the final up-move ends again at 4.236 levels.
I am sharing only three charts. Also, not every move in every pair is so accurate, but most moves satisfy these rules. I hope my observation helps in building a profitable strategy. Again real thanks goes to Nut and raedmaa.
I am seeing the strategy of Nut and observation of raedmaa repeat over an over again. According to Nut's strategy, important levels come out to be 1.618, 2.618, 4.236.....What raedmaa says is that most dominant trends end at 4.236. Here I am attaching few charts of GPY JPY 4H. I am showing only one of various moves, but if someone studies other pairs they will find almost similar occurrences everywhere. Most trends end at 4.236 levels. Till now I have studied 4H charts. Important thing is to find the right turning point. Charts are almost self explanatory....
Ignored
A nice post thank you. I think the message here is there is more than one way to skin a cat. But once you have a viable method stick with it. Here are two viable methods only you can choose which one to use.
I am seeing the strategy of Nut and observation of raedmaa repeat over an over again. According to Nut's strategy, important levels come out to be 1.618, 2.618, 4.236.....What raedmaa says is that most dominant trends end at 4.236. Here I am attaching few charts of GPY JPY 4H. I am showing only one of various moves, but if someone studies other pairs they will find almost similar occurrences everywhere. Most trends end at 4.236 levels. Till now I have studied 4H charts. Important thing is to find the right turning point. Charts are almost self explanatory....
Ignored
The most important question is what high or low you should start your cycle with .. what criteria does it have to satisfy before you consider it true hi or lo?
every point on the chart have a cycle from the 1m chart to the monthly .. the lower cycles fullfill the bigger cycles ..
the 2nd important question is what makes it high probability that it will go to the next level? and not reverse.
there is a gate for each level once penetrated it will go to the next.
i will let you do your research ... i am on the mobile cant post charts.
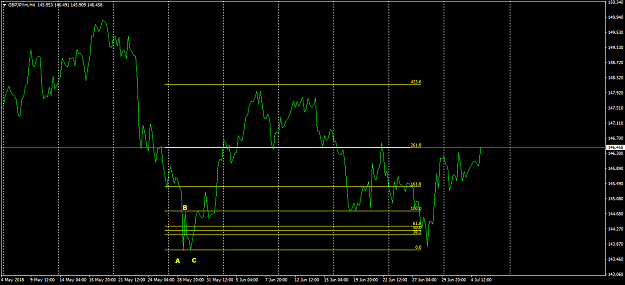
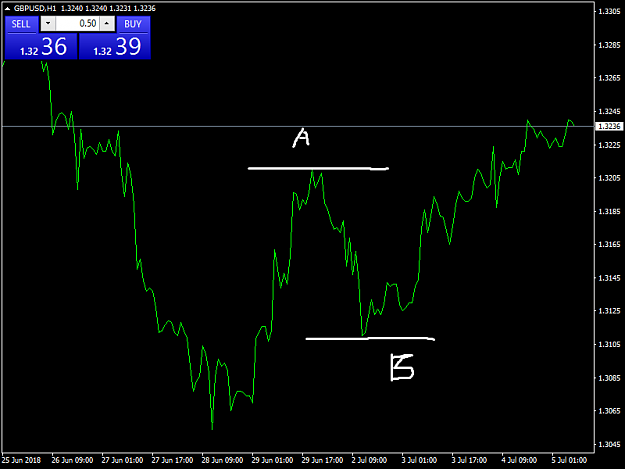
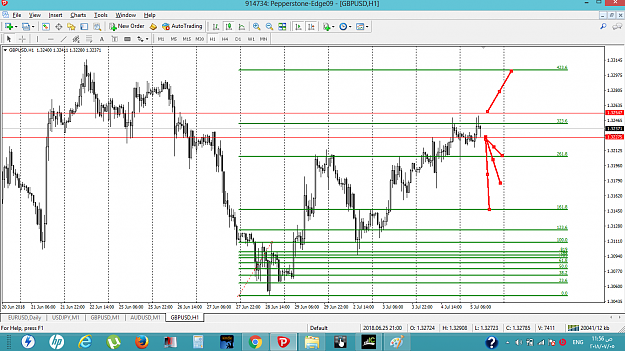
Firstly, I would like to thank Nut for starting this thread and help traders like me to make money consistently. I clearly do not understand how to determine the datum line after rounds and rounds of reading the whole thread + the videos. Sorry about that. Let say, I take 1 hour chart of GU.
Should I take the highest high of yesterday daily candle(A) and low of yesterday's daily candle(B)? I usually trade base on SNR and CS only, but this seems interesting.
Hi Nut and all, Firstly, I would like to thank Nut for starting this thread and help traders like me to make money consistently. I clearly do not understand how to determine the datum line after rounds and rounds of reading the whole thread + the videos. Sorry about that. Let say, I take 1 hour chart of GU. Should I take the highest high of yesterday daily candle(A) and low of yesterday's daily candle(B)? I usually trade base on SNR and CS only, but this seems interesting. {image}
Ignored
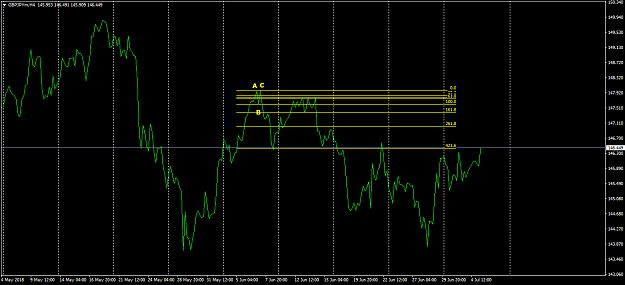
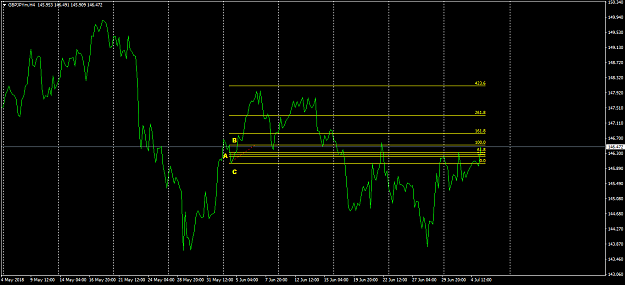
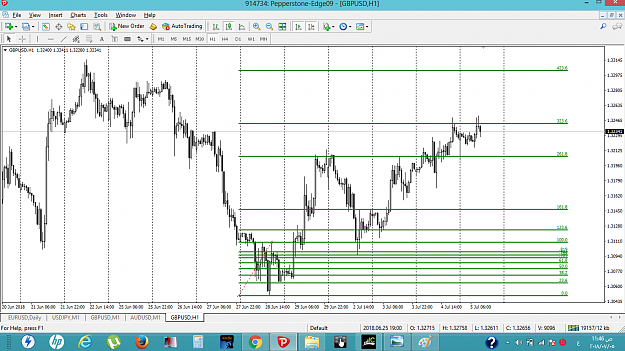
Hi Mza55,
IMHO, this is the right start. You want to measure an uptrend, so the orientation of 0.618 is up, but you measure the last extreme down candle ( including downwick ).
Nut, if I'm wrong, please shoot me ...
{quote} Hi Mza55, IMHO, this is the right start. You want to measure an uptrend, so the orientation of 0.618 is up, but you measure the last extreme down move. Nut, if I'm wrong, please shoot me ... {image}
Ignored
there is no right or wrong -- every point have a cycle.