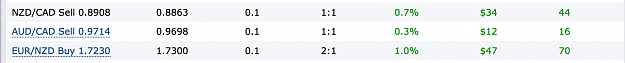
I took this trade on my live nano account.
The daily rsi2hlc3 had crossed below 30
And this is second bearish candle on the linebreak chart of tradingview.
I wish i can get alert when linebreak candle changes color and rsi2hlc3 touches 30 or 70.
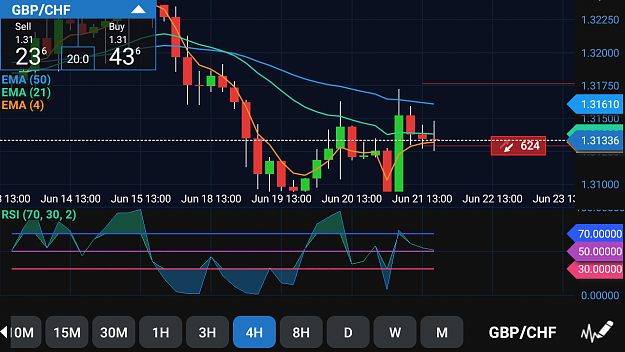
On the pic you can see rsi2hlc3 on 4hr is above 70 and the candle looks bearish.
My sl is above latest high, i will check every 4hr, when rsi crosses 30 and i sense bullish price action i will getout.
The daily rsi2hlc3 had crossed below 30
And this is second bearish candle on the linebreak chart of tradingview.
I wish i can get alert when linebreak candle changes color and rsi2hlc3 touches 30 or 70.
On the pic you can see rsi2hlc3 on 4hr is above 70 and the candle looks bearish.
My sl is above latest high, i will check every 4hr, when rsi crosses 30 and i sense bullish price action i will getout.
Attached Image (click to enlarge)