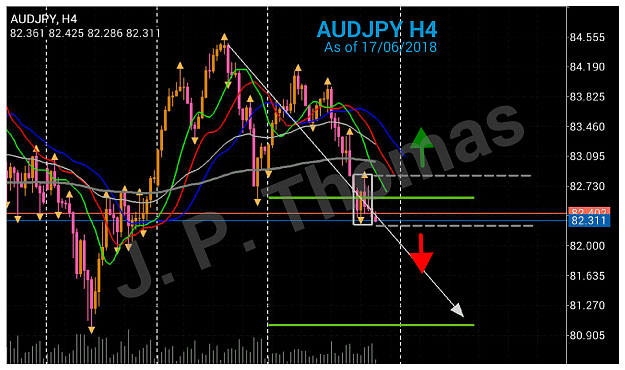
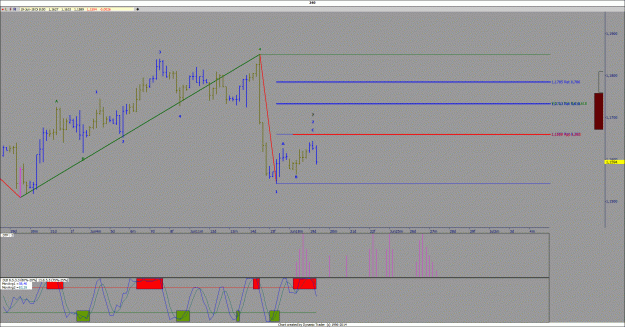
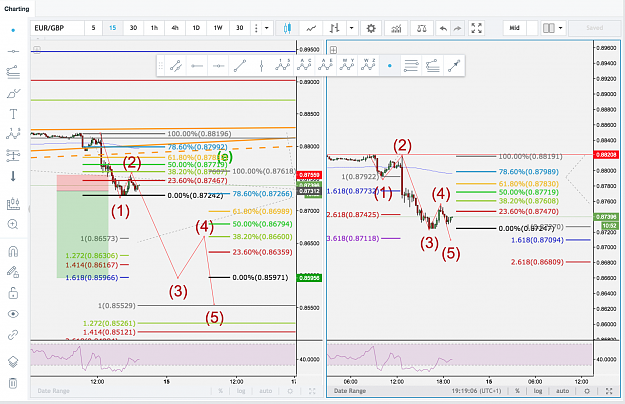
DislikedF.g., watch the Flash movie of the software again: https://www.deltasociety.com/content/one-day-time The highs are indicated at the top and the lows at the lower side. The red and black lines left and right of the numbers show the time range when the turning points of these time frames can occur. SixerIgnored
- #528
- Edited 11:09am Jun 16, 2018 9:01am | Edited 11:09am
- Joined Nov 2008 | Status: Trader | 1,757 Posts