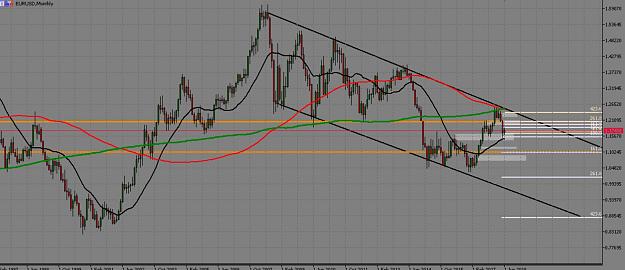
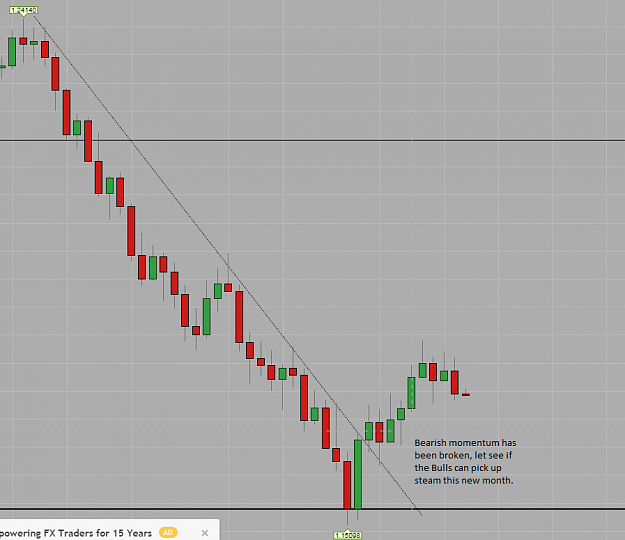
{quote} I also think we are on a uptrend. Here's a look at the monthly {image}
Ignored
Dude, your chart is like The Media, just the side or piece they would like to present that backs their story...
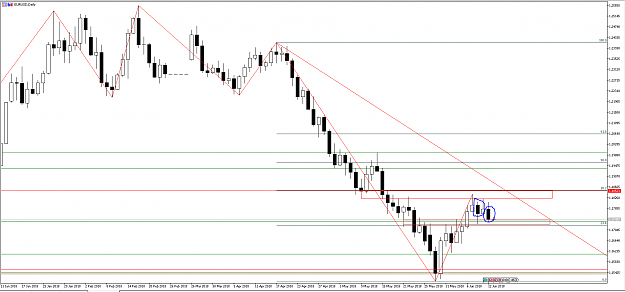
This is monthly chart - show me the up-trend...so far channel down, once we break, thats continuation...
Attached Image (click to enlarge)
Instagram - FX_ELITE_Europe | In Search of #BIG_R | Need No Small Pips
{quote} Dude, your chart is like The Media, just the side or piece they would like to present that backs their story... This is monthly chart - show me the up-trend...so far channel down, once we break, thats continuation... {image}
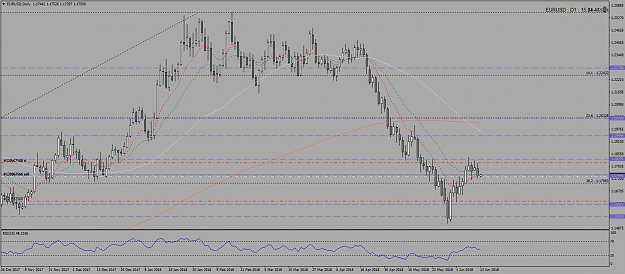
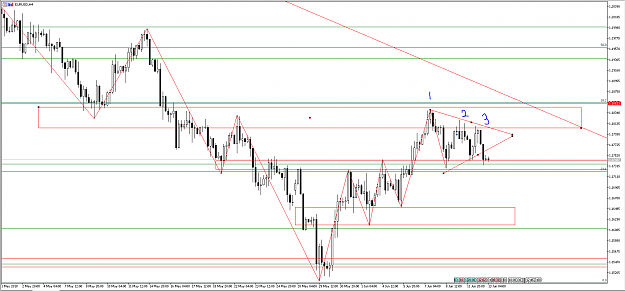
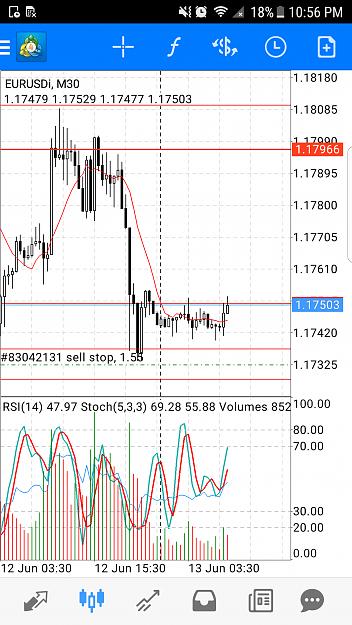
On the daily chart, we got two bearish engulfing candles as well as a 38.2 Fib retracement. Leads me to believe that the bulls are caving in.
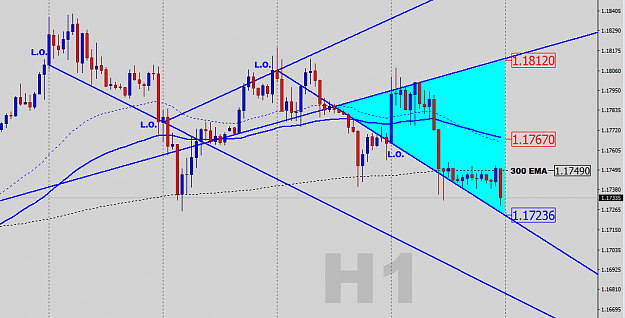
On the 4 hr, We have a 3 test or triple top on a MRA, triple test are usually a reversal patterns, followed by lower highs.
On the 1 hr chart, the last two testof support, Asia and Sydney push had momentum shifts, the third test shows a lack of support.
On the 15 min continuation pattern triangle.
Final conclusion, everything is telling me to sell. Due to area having historical support, extra confirmation for my sellers would be a break under of support then retest. for my buyers, I do not advise holding out your long position anymore or placing any buy orders.
but as always, do your own research and stick to your trading plan! to his their own. happy trading!
USDX looks bullish across the board.
Bearish engulfing... correlations are in place (and perform)... I gotta try this.
Very cautious small split position (Short), TP1 is set and covers 50% of the risk, T2 is open (not set, will trail Stops).
Please do NOT copy this, this is not my usual setup on the Daily and I might as well get stopped. (stop is tighter than usual)
This is not an intraday trade. Please do not copy this.
I anticipate a red flag trigger...
{quote} Dude, your chart is like The Media, just the side or piece they would like to present that backs their story... This is monthly chart - show me the up-trend...so far channel down, once we break, thats continuation... {image}
@teek
If you sell this, my advice would be a sell stop at 1.17325. To avoid any potential reversal for whatever reason, Like i said tho, extra confirmation would be a break lower then retest, forming lower high. Thats just my 2 cents tho. If you already have a superb entry tho, by all means.
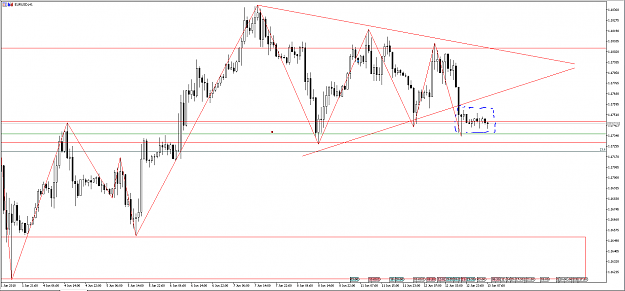
{quote} Yes ! we have the same structure on H4. We are on a supply zone. imo, it is impossible to sell at this area, at miminum we will go to the high of the range . If we break the support then ok for selling but not before {image}
Ignored
Agreed, if we break support then get short on the retracement back. Likewise if we break 1.1755 ill be going long on the retracement. Lets see if the London open will give us a clear direction. But we might be stuck in the range for this week?!?
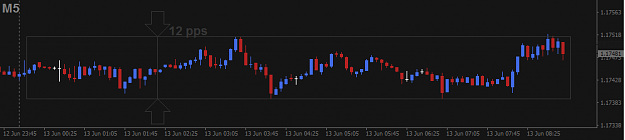
Hey, intraday scalping brothers, is this the Asian session? ...great 12 pips range!
Do you really think you're gonna see a trend today until the Fed ??? This Fed hike is a long time ago done deal!!!
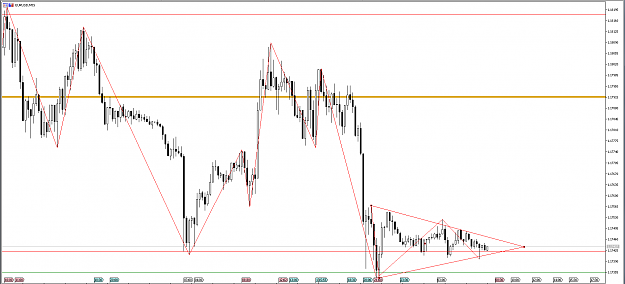
@teek If you sell this, my advice would be a sell stop at 1.17325. To avoid any potential reversal for whatever reason, Like i said tho, extra confirmation would be a break lower then retest, forming lower high. Thats just my 2 cents tho. If you already have a superb entry tho, by all means. Also this is a demo trade i have running. update: scrap this entry, im just demo trading {image}
Ignored
It's a "blindifre" correlation trade based on momentum on the "main" trade, which is on another pair...
The W1 D1 H4 setups scream Short. It's not about the pip-exact entry here, it's about the Stops and covering the risk, somehow.
Might go a little bit wrong, or massively right... gotta take it.
In order to live you must be willing to die ~ Amir Vahedi
{quote} Dude, your chart is like The Media, just the side or piece they would like to present that backs their story... This is monthly chart - show me the up-trend...so far channel down, once we break, thats continuation... {image}
Ignored
Thx for the reply. I still havent taken any positions yet, Im still waiting for more conformation on my part.
On the daily chart, we got two bearish engulfing candles as well as a 38.2 Fib retracement. Leads me to believe that the bulls are caving in. On the 4 hr, We have a 3 test or triple top on a MRA, triple test are usually a reversal patterns, followed by lower highs. On the 1 hr chart, the last two testof support, Asia and Sydney push had momentum shifts, the third test shows a lack of support. On the 15 min continuation pattern triangle. Final conclusion, everything is telling me to sell. Due to area having historical support, extra confirmation...
Ignored
Nice work bruv!
Instagram - FX_ELITE_Europe | In Search of #BIG_R | Need No Small Pips