Hi Guys,
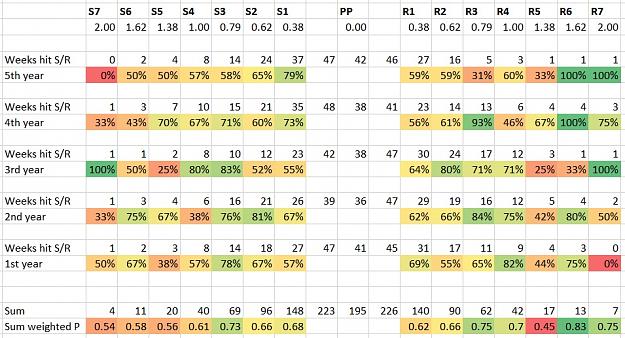
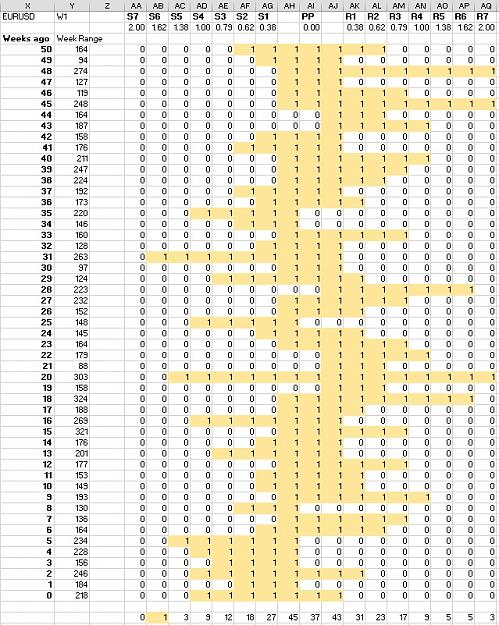
Have been following this thread off and on for a while now and have decided to do some more in depth analysis to see how price reacts to pivot levels. I've computed pivot levels for the past 52 weeks of EURUSD and plotted how far price has traveled each week in relation to pivots. Below is the result.
A couple of observations:
Price has passed R2 and S2 (0.62 pivot) 41 times in the past 51 weeks. I've then computed the probabilities of what happens after it has passed this point giving the following table.
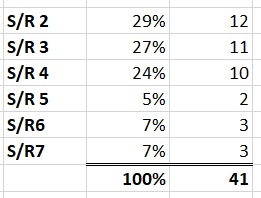
What this shows is that of the 41 times price has passed R2/S2, 12 of these weeks price never crossed S/R 3 (29% of the 41 weeks); 11 times never crossed S/R 4 after crossing S/R 3 (27%) and 10 times never crossed S/R 5 after crossing S/R 4 (24%).
This support Davits view of price retracing from these points 0.61 - 1.00 pivots.
Some more stats... When price is in S/R2+ zones there is a 44% chance that price will cross 1.00 pivot and a 20% chance that price will cross 1.38 pivot.
This sort of states the obvious that the higher the price travels from the pivots, the more likely it is to retrace. In future I'll be comparing various pairs to see which react to pivots better/more predictably, pivot timeframes and other things as ideas come to me.
If you have any ideas on analysis, let me know and i'll share my info/results with you all.
Cheers,
David
Edit: These stats are based on EURUSD 1 year data with pivots calculated weekly so may not be accurate for other pairs and pivot timeframes.
Have been following this thread off and on for a while now and have decided to do some more in depth analysis to see how price reacts to pivot levels. I've computed pivot levels for the past 52 weeks of EURUSD and plotted how far price has traveled each week in relation to pivots. Below is the result.
Attached Image (click to enlarge)
A couple of observations:
Price has passed R2 and S2 (0.62 pivot) 41 times in the past 51 weeks. I've then computed the probabilities of what happens after it has passed this point giving the following table.
Attached Image
What this shows is that of the 41 times price has passed R2/S2, 12 of these weeks price never crossed S/R 3 (29% of the 41 weeks); 11 times never crossed S/R 4 after crossing S/R 3 (27%) and 10 times never crossed S/R 5 after crossing S/R 4 (24%).
This support Davits view of price retracing from these points 0.61 - 1.00 pivots.
Some more stats... When price is in S/R2+ zones there is a 44% chance that price will cross 1.00 pivot and a 20% chance that price will cross 1.38 pivot.
This sort of states the obvious that the higher the price travels from the pivots, the more likely it is to retrace. In future I'll be comparing various pairs to see which react to pivots better/more predictably, pivot timeframes and other things as ideas come to me.
If you have any ideas on analysis, let me know and i'll share my info/results with you all.
Cheers,
David
Edit: These stats are based on EURUSD 1 year data with pivots calculated weekly so may not be accurate for other pairs and pivot timeframes.
31