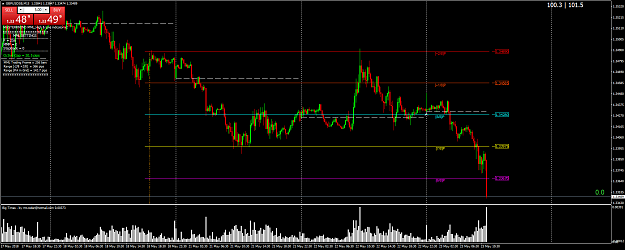
Example of chart shift down (out of the box m/avg) showing no signs of stopping just yet, not to say that we will see some bounce action at various levels maybe 4/8ths
Example of chart shift down (out of the box m/avg) showing no signs of stopping just yet, not to say that we will see some bounce action at various levels maybe 4/8ths {image} {image}
Ignored
I've extended my stop out a bit on GU to below the -2/8 MML.
Risk on this trade now stands at approximately 3.5%.
However, with all the news floating around the cable hasn't had much of a chance to recover some ground and now it looks set to drive deep into the low 1.30 prices.
Perhaps closing out the trade is a very real option but I'll give it a little more rope and see if the bulls can make a comeback.
{quote} I've extended my stop out a bit on GU to below the -2/8 MML. Risk on this trade now stands at approximately 3.5%. However, with all the news floating around the cable hasn't had much of a chance to recover some ground and now it looks set to drive deep into the low 1.30 prices. Perhaps closing out the trade is a very real option but I'll give it a little more rope and see if the bulls can make a comeback. Chart shifts to the downside spells caution ! Masterrmind.............
Ignored
It means contraction of the "Volatility" (Price Range) then division by 2 of the Operative Octave
Its going to be tough as its a Waterfall for sure ?
Ps Parisboy I think you are a good friend and a great trader just wish i could learn you some English Slang so i could understand what you mean. hahahaha
Its going to be tough as its a Waterfall for sure ? {image}
Ignored
No idea
Martin Armstrong slang : Marty uses the term " Waterfall Event" when a financial support loses roughly +/- 90 % of its value in a short period (2-3 years)
Example :
Deutsche Telekom, France Telecom (Orange), Alcatel Lucent, Alsthom etc
{quote} No idea Martin Armstrong use the term " Waterfall Event" when a financial support loses roughly +/- 90 % of its value in a short period (2-3 years) Example : Deutsche Telekm, France Telecom (Orange), Alcatel Lucent, Alsthom etc
Ignored
Sorry my friend, its my problem you post very precise technical descriptions and have a deep understanding of this game, but they are hard for me to understand as i can barley sting two words together never mind spell my name, that's why i have spent 1,000's of hours just looking at charts with my eyes trying to make sense of it all, if indeed there is any
Example of chart shift down (out of the box m/avg) showing no signs of stopping just yet, not to say that we will see some bounce action at various levels maybe 4/8ths {image} {image}
{quote} It means contraction of the "Volatility" (Price Range) then division by 2 of the Operative Octave
Ignored
Contraction means a reduction in something.
When price breaks out down below the -2/8 MML (or above the +2/8 MML) price line then the 'current' MML Grid is actually in a state of expansion until the 'new' updated MML Grid prints to the chart.
Ofcourse this update takes an almost immediate effect.
The pip distances between the minor octive borders can either increase (expand) or decrease (contract) based on the internal calculations which relies rather heavily on the recent PA (ranges) and this includes the historical bar count as per chosen Period (such as P=64, 128, 256 etc).