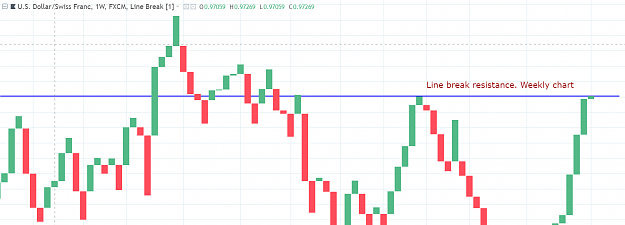
Disliked{quote} lmao I don't drink.. Right need some sleep. I'd wait until the RSI 2 moves above 70.. This is a line break 1 chart. Not a normal candle chart. If the USD/MXN is dropping like it is then the USD is very weak at the minute. Best to wait. Although it's the Asian session. See how it reacts at London Open. {image} {image}Ignored
Edit: OK, so I took the time to read a couple of articles about Line Break charts, so I'm now familiar with them and know how they are constructed (looks like the typical construction is with a value of 3 rather than 1). So, I guess my question is still valid about how you have found them useful, especially with a value of 1...and I presume only on a Daily chart?