A REALLY SIMPLE TRADING STRATEGY
I would like to share with you a really simple trading strategy or methoddology that can be applied to any market.
It still forms part of one of my few strategies that apply even now 11 years later, albeit tweaked to suit my approach.
For new traders it can be the first building block towards making your own strategy and is very powerful when applied with discipline and correct risk/trade management.
It can be tweaked and molded to suit the traders risk appetite and experience at their leisure and when they feel comfortable.
You can add other technical elements to increase the probability of forecasting the correct path price will take along with fundamentals should you wish to understand the secular trends.
Let's begin:
Firstly, I suggest you start on a 4 Hour chart.
I suggest you remain on the 4 hour chart until you get used to applying the methodology and then by all means go higher or lower.
On the 4 hour chart there seems to be an abundance of small trends that remain intact for a good amount of pips (50-100+) once they get some traction and momentum so I favor this time frame and have done for many years with this particular methodology.
That is not to say that I don't keep an eye on the higher time frames for larger trends that I will ride as long as possible. I will go into multiple time frame analysis later on in the post.
Is the market ranging or trending?
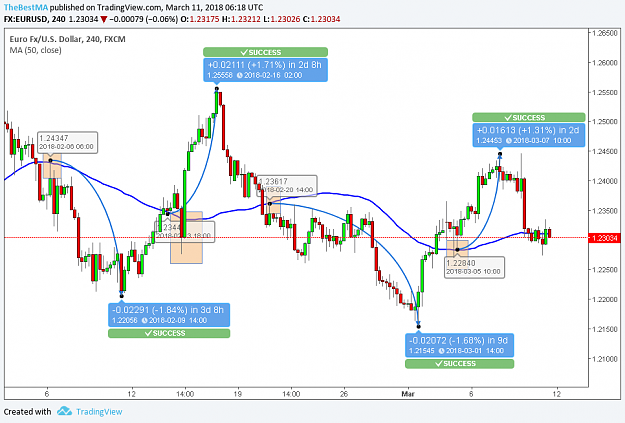
Below is a 4 hour chart of AUD/USD with 50 period simple moving average.
If you are very new to trading, the 50 period moving average is plotted with the automatic calculation of average closing price over the previous 50 4 hour candles.
Attached Image (click to enlarge)
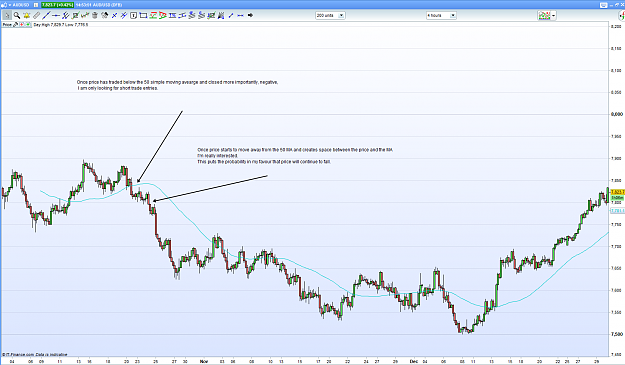
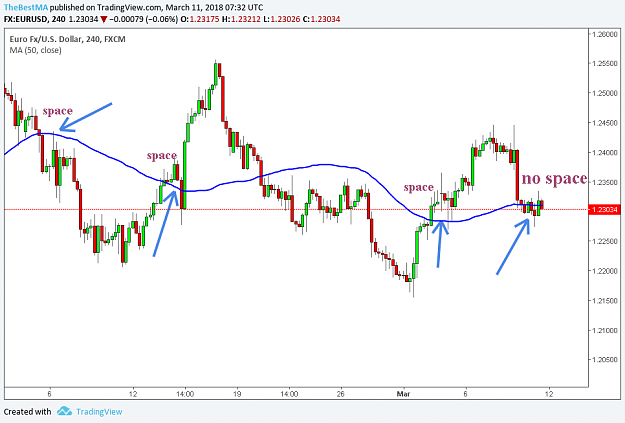
Now you see when price has traded below the 50 ma (simple moving average) and closed negatively and notice, this is important it is a decent close below the 50 ma. It is these small details that help build the confidence in our forecasting. Remember you can see the future on the chart above where as this will not be the case, when trading live - this is to illustrate my point for identifying whether it is trending or ranging.
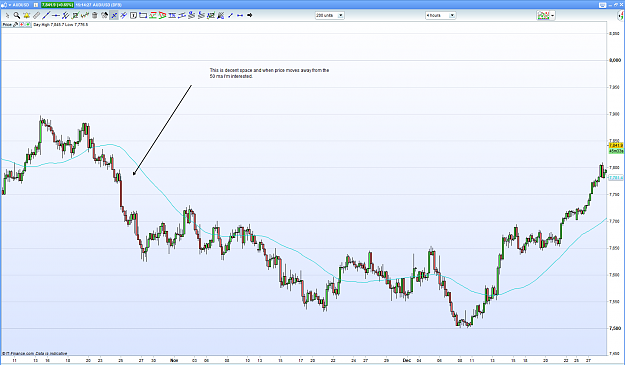
Once you see price close and begin to move away from the 50 ma creating space this affirms some momentum in the move, and I become interested.
This also gives me another piece of information, that when price is below the 50 ma I only want to be short and when price is trading above the 50 ma I only want to be long.
See below.
Attached Image (click to enlarge)
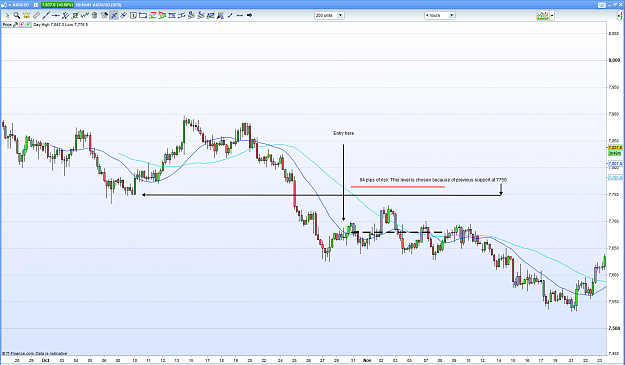
Now this has given me a reason to believe that this could be the beginning of a large or small trend that is forming and I want to get involved.
Entry technique
For the entry, we apply a simple visual tool to aid us, anyone guessing what that is yet? Yep, another simple moving average. A 21 period moving average.
Attached Image (click to enlarge)
We wait patiently for price to pull back to the 21 ma to gain an entry. It is the first touch of 21 ma that we want! It can be an 'air kiss' as in almost touching or an absolute touch. If it is 4 pips or more away sit on your hands until it is 1 pip or touching. If you don't get the trade you wait. You cannot trade them all. Let price come to you.
If you are very new to trading, at this point I would like to point out that the sooner you understand and digest that the life of a trader is as much losing as winning you will become comfortable losing, and let me re-phrase that, losing small in relation to your account. 1-2% that's how you survive and build your winners slowly over time.
With a small account say £2000 you would trade with 0.50 per pip for a max risk of around £40 or 2% of account
It's those traders who manage their losses and maximize their gains who survive and make some money.
That's the short entry explained briefly, now we have to look at risk and trade management. I will be updating this thread as soon as possible.
With this kind of strategy, it also gets you used to actually reading the markets. This is so important if you wish to become consistently profitable.
No disrespect to the EA crew but you are not reading the market, awaiting an arrow to by or sell.
I really encourage aspiring traders to attempt to read the markets, that way you will become much more informed and intuitive.
If you only do as the next man you will only be as good as the next man but you don't want to be just as good as the next man you want to be better!
We have covered entry on the short side and the details I like to see such as space and momentum and only being long when price is above the 50 ma and only being short when price is below the 50 ma
Now we can add some further analysis
If we would like to extract as much from the market as possible what should we be looking at ?
That's right the Daily, Weekly and Monthly charts and other entry opportunities with in the same methodology.
This can give us an understanding of the longer term trend and/or potential turning points and limit risk.
Once we determined the larger more dominant trend we can begin to work out targets and/or forecasts.
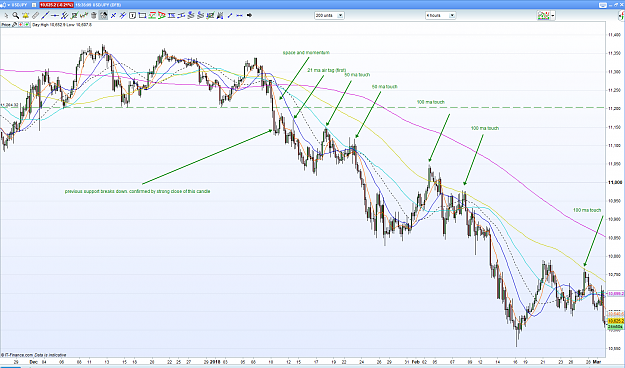
I specifically picked the 21 ma for an entry technique. However, I stress this does not always need to be the 21 ma.
Note that there is reactions off of the 21ma but not always. This will be likely for the 34, 50, 100, 200 and 500
I suggest you plot all of these on your charts to see exactly what I mean. It is then your choice where to enter and what ma to enter on.
Just like support and resistance it is a zone, not a specific line. It can be, but more often than not it is spread over a few pips on a smaller time frame to a 50 or more on a larger time frame.
The idea is to pick the sweet spot. That is why sometimes the 21ma will react and other times it will be the 34, 50 etc...
The reason I'm telling you this is because with most methodologies(strategy) you should have a fluid approach, some-what flexible and pays to remember this.
The reason you are required to have this open mind with fluid approach is simple, the market never really repeats exactly what it has done historically so you must adapt yourself!
This way of thinking is what gives you a greater understanding of the markets than most because you already approach with an open mind and not strict rules. This is where most novices will fall short.
Novices rely on strict rules and are not really reading the market.
A systematic approach can still be flexible.
See below.
Attached Image (click to enlarge)
Depending on varying factors would depend on where you get in.
With the first air tag of the 21 ma the risk is still small if your stop is placed above previous support which is now resistance.
This won't always be the case. Sometimes price will move away from the other moving averages and momentum will carry it quickly and then the first touch of the 21 ma might be looking good however, you must always bear in mind your risk and stop placement.
Placing a stop at a set amount each time is not advisable if it doesn't suit the market.
Position sizing according to risk is how the approach should be adopted.
Example of set stop price.
Account size $2000
2% $20
Stop placed at set distance irrespective of market conditions.
This is not putting probabilities in your favour.
Instead, you adopt the flexibility previously mentioned and wait patiently for the correct set up so you can place your stoploss in the correct position and/or you reduce your position size so you can place the stop further away.
See below
Attached Image (click to enlarge)
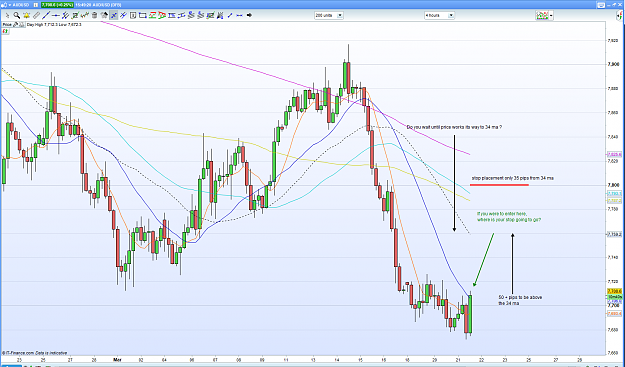
Which leads me onto looking at the larger higher time frames for aiding the probability onto your side.
The chart above is AUD/USD 4 hour
Day traders would be looking for longs, maybe even swing traders who were not reading the market might equally want to be long.
I would be looking for shorts.
Check the weekly chart out below to see why.
Attached Image (click to enlarge)
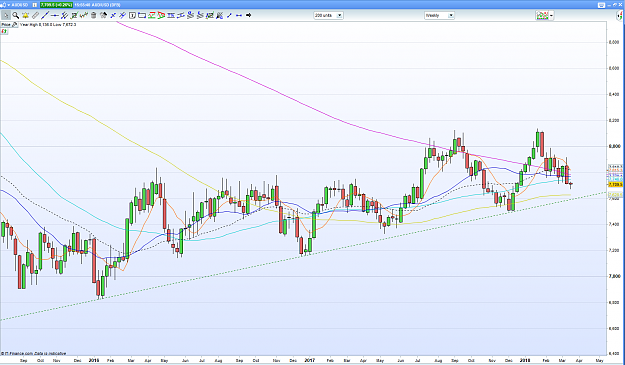
See that trend line? That's my short target. That is the reason I'd be selling any rallys.
Welcome all conversation on trading Follow me on Twitter @able_trading