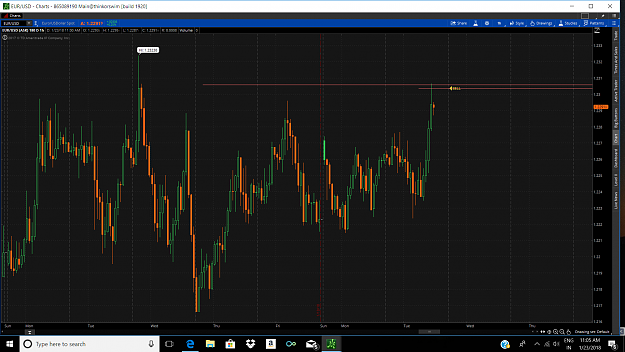
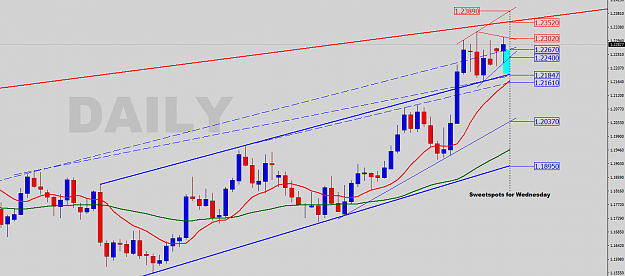
The EUR/USD daily Forex chart has been in a tight trading range for a week. The chart appears to be a bull flag. The odds favor a bull breakout.
With current momentum, there is a 70% chance of a bull breakout and a 30% chance of a bear breakout.
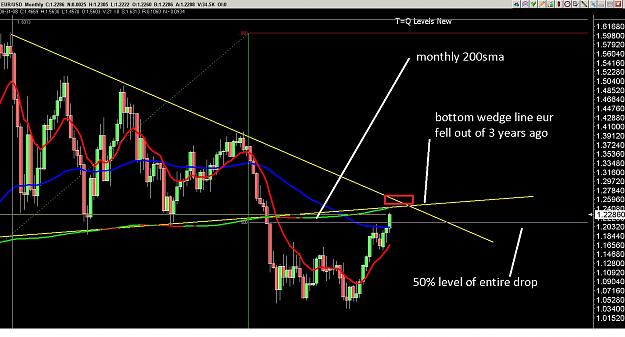
Since the chart is testing the bottom of a 10-year trading range on the monthly chart, it is at resistance. It is also near the top of a wedge rally on the monthly chart. Consequently, the bears are hoping for a reversal down that could last several months. In the absence of consecutive big bear bars on the daily chart, the odds continue to favor higher prices and bullish breakout.
With current momentum, there is a 70% chance of a bull breakout and a 30% chance of a bear breakout.
Since the chart is testing the bottom of a 10-year trading range on the monthly chart, it is at resistance. It is also near the top of a wedge rally on the monthly chart. Consequently, the bears are hoping for a reversal down that could last several months. In the absence of consecutive big bear bars on the daily chart, the odds continue to favor higher prices and bullish breakout.