My indicator is still in beta test.....i have to improve it
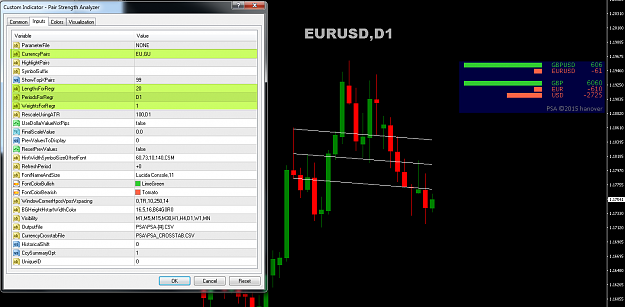
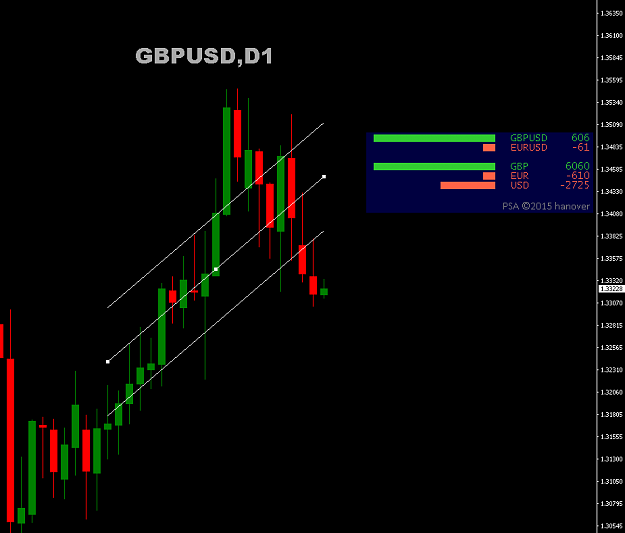
Hanover, i'd like to code an EA ...but i 'd like to know , if it's possible: what rappresents the number plot by PSA???..... i want to say: it's a number of pips? i don't understand exactly what number rappresent.
I'd like to find a good cutoff for using in an EA
Anyway my congratulation for your indicator it's great OK!
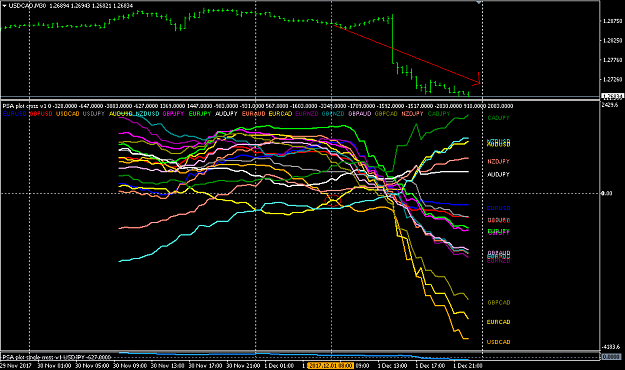
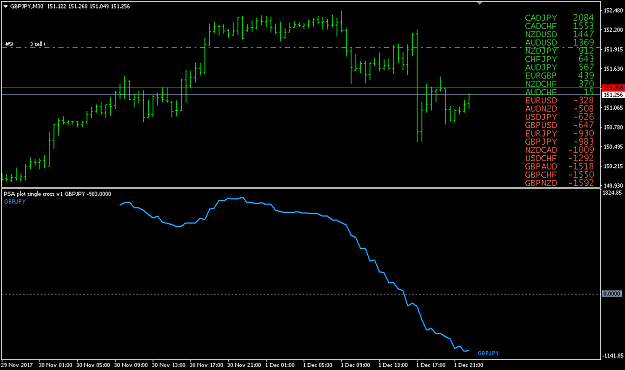
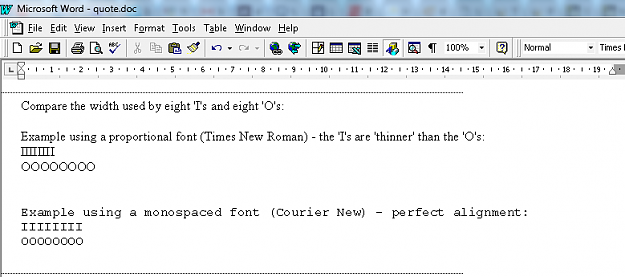
Attached Image (click to enlarge)