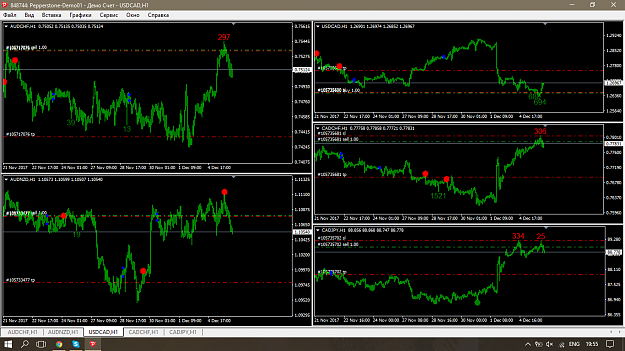
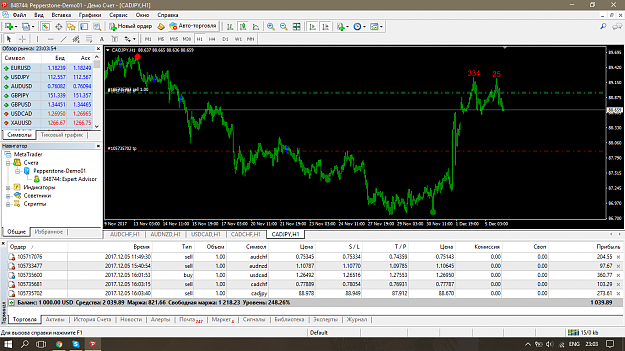
{quote} That looks good, you should be able to make that work for you, probably should position size those trades to make the results look more true to life Can you share how or what you use to set Stop Loss / Take Profit? Seems high to me for the 1 hour chart; I would use the projected daily high or low using ADR (50) as I find that can be excellent most time Speaking of time, this signal right at New York first hour, which is when you would expect CAD traders to be active. Bar was about 30 pips so it didn't make 2 to 1 yet, but not far off. And...
Ignored
hi yes i catched USD/CAD and about SL/TP i manually put it based on S/R thanks
{quote} Thanks Erebus. I have yes a long time ago, I think it may not be a bad idea to re-visit it again. Thanks for joigging my memory.
Ignored
I have been watching for an example and finally found one, probably pretty rare so that is why an indicator would be needed otherwise never find these quickly enough to trade, except Daily of course
Now, this is only what I have picked up from Walter P's videos, not sure if any hard and fast rules would make it better or worse
But some guidelines are need to be able to code the indicator obviously
So, basically just an Inside Bar filtered by location eg. top or bottom third of first candle, with an alert
So my interpretation is that Candle 1 represents the Cliff which the Diver jumped off, Diver being represented by Candle 2. The Deep Water is Candle 3 and more hopefully (careful, don't drown the little guy)
So, is a filter required to check for longer than normal candles? Maybe, but for sure the Close has to be near the Low or High (what's it called in the UP direction?)
What is the largest Diver allowed? I have the impression that 33% of candle one is the criteria but could be user selectable I suppose
Entry can be usual breakout, stop loss as per user's trade plan / risk profile / back tested of course!
On this chart, red boxes are Inside Bars, already 2 successful setups and then the ACAPULCO
Good luck all
Attached Image (click to enlarge)
It takes a lot for me to IGNORE you, but you can try.
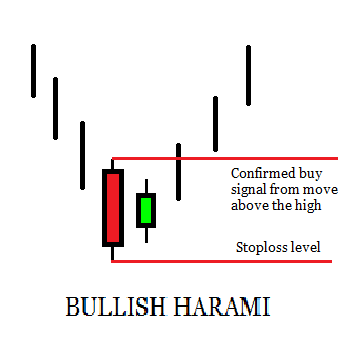
Erebus, it's called harami, works well in GBPUSD as trend continuation. Forms flag or wedge on smaller tf's. They are worth a shot, I found they worked less than 50% of the time on other pairs than GBPUSD on D1.
Erebus, it's called harami, works well in GBPUSD as trend continuation. Forms flag or wedge on smaller tf's. They are worth a shot, I found they worked less than 50% of the time on other pairs than GBPUSD on D1.
Ignored
Ah ha, but it's not a trend continuation pattern if you did any research
What is a 'Bullish Harami'
A bullish harami is a candlestick chart pattern in which a large candlestick is followed by a smaller candlestick whose body is located within the vertical range of the larger body. The bullish harami is a downtrend or bearish candlestick (red) engulfing a small bullish candlestick (green), giving a sign of a reversal of the downward trend. Since the bullish harami indicates the bearish trend may be reversing, it may be a good time to enter into a long position.
Also, the 2nd candle position is usually shown as centered within the Mother candle, like a bump, in fact, many sites point out harami means pregnant in Japanese. And the colors are usually shown as being opposite to reinforce the reversal signal.
The pattern I show is specifically with the lower or upper confines of the 1st candle as per my example and description already given
Thanks for your concern
Attached Image
It takes a lot for me to IGNORE you, but you can try.
Joined Oct 2015
|
Status: Focused on the Results
|1,491 Posts
It's hard to leave without saying something, you guys are onto one of my heart beat methods. Price action, no matter what type of trading method one does, when nothing is working and one goes back to basics, the price action method saves the day. So why not ensure that price action is always involved. Just like salt in cooking.
Erebus and zoheb good stuff.
I had been doing some ongoing research about this topic and I like to keep things simple.
I like trading in a trending scenario two setups:
1. Shooting star/evening star in an uptrend, where a key level of resistance exist.
2. Hammers / morning stars at significant support Levels in a Down trend.
I found favorable filters for the scenarios above. It's quite safe to say there are ideal colours of the opposite trending color to be our signal but the opportunities come in same color candles as well, so formation in conjunction/confluence to the previous bar is very important, where a formation within the body of the previous bar is best.
Risk to reward is great when there are no immediate hindrances (moving averages, support and resistqnce) in between a 1:2 or more.
There are also good pivot levels to expect these to show up.
When they show up at these levels, a 1:2 is a minimum target.
Entry: I use pending stop orders as well as pending limit orders closest to 50% retrace of the signal candle - pinbars to be exact and pinbars are great for the relatively good risk that it provides at the tail versus the vast reward it can give especially when It lines up with the trend.
Timeframes- this is applicable on any timeframe and we should know that the higher it is the longer the duration and more profitable the trades will likely be should it be successful. But I have met traders who have used it in both forex and binary options on m5 timeframe upwards.
Unfortunately: there are a lot of indicators on the market and I find that on previous bars they would identify all types of signals in terms of quality but the hardest one to find are those that show up in live market at the immediate close of the signal bar for all timeframes.
I am interested in lowest timeframe m5 and highest MN.
So i will definitely try out this one with high hopes.
Cheers...
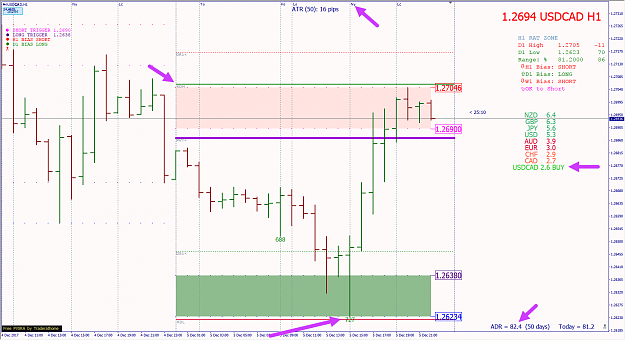
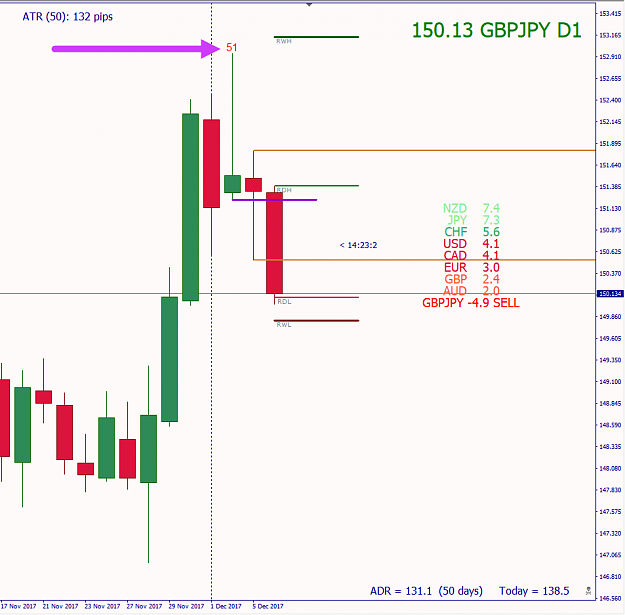
Darn, didn't get to the charts early enough, should have been watching this daily signal breakthrough down on the 1 hour chart Now it has made the ADR, could end up anywhere... {image}
Ignored
At least the signal worked! Thanks for your contribution to this thread.
Never stop investing. Never stop improving. Never stop doing something new
{quote} Ah ha, but it's not a trend continuation pattern if you did any research What is a 'Bullish Harami' A bullish harami is a candlestick chart pattern in which a large candlestick is followed by a smaller candlestick whose body is located within the vertical range of the larger body. The bullish harami is a downtrend or bearish candlestick (red) engulfing a small bullish candlestick (green), giving a sign of a reversal of the downward trend. Since the bullish harami indicates the bearish trend may be reversing, it may be a good time to enter...
Ignored
This is coming in v1.2!
Never stop investing. Never stop improving. Never stop doing something new
It's hard to leave without saying something, you guys are onto one of my heart beat methods. Price action, no matter what type of trading method one does, when nothing is working and one goes back to basics, the price action method saves the day. So why not ensure that price action is always involved. Just like salt in cooking. Erebus and zoheb good stuff. I had been doing some ongoing research about this topic and I like to keep things simple. I like trading in a trending scenario two setups: 1. Shooting star/evening star in an uptrend, where a...
Ignored
Excellent contribution. Thanks so much. Gald you are enjoying the indicator
Never stop investing. Never stop improving. Never stop doing something new
Zoheb01 let me to share my indicator. I think it will help you to make faster analysis, and if you see the chart later it helps you to make a faster decision. I think, I will not share any analysis, this thread is about the PA indicator.
The indicator is great, but work only if you have tha ability to understand the price movement. There are some suggestion to learn how to analyse the chart:
If you place a horizontal line, the indicator will replace it to 2 line which create a zone filled with "color". If you move any of this lines the color will fill the zone. The color of the zone depend on on which TF was the line placed. So you can prepare the chart and if a signal is there you will see easily where are the support and demand zones.
Thanks for the work on this indicator, and videos. Very helpful for those who learn visually, and indicator will help in scanning/training the mind to pick up on these various movements. Subbed, and keen for the updates!
Hi zoheb!
Great work on the indicator. Is it possible to get my hands on the code? I would love to create a multi timeframe and currency scanner out of this and share it with the group.
Thanks for the work on this indicator, and videos. Very helpful for those who learn visually, and indicator will help in scanning/training the mind to pick up on these various movements. Subbed, and keen for the updates!
Ignored
Thanks John. Happy new year to you and everyone!! Been working on v1.2 so please stay tuned.
Never stop investing. Never stop improving. Never stop doing something new