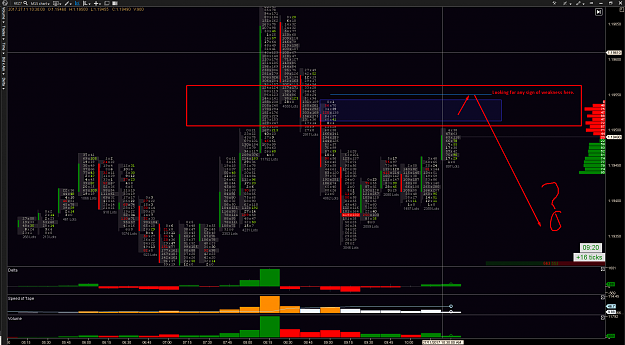
Looking for any sign of weakness there EURO {image} {image}
Ignored
Hi man, getting my teeth stuck into whatever resources I can find to learn the order flow footprints but was wondering if you have to pay to actually get access to the footprint charts etc?
{quote} Hi man, getting my teeth stuck into whatever resources I can find to learn the order flow footprints but was wondering if you have to pay to actually get access to the footprint charts etc?
{quote} Yes most of them are paid, there a few brands.
Ignored
Hi guys how's things around
This got me curious, in fact there are more footprint charts providers, I wonder if anyone is using another one of this providers other then ATAS if so , could you post a chart of the same "timeframe", same period and same market or currency, just for comparison of data, would be a good exercise.
In my idea if they both use the same providers, I mean the biggest data feed providers, they all say they use more or less the same ones, then the provided footprint data should be very similar, not exactly the same but very similar in theory.
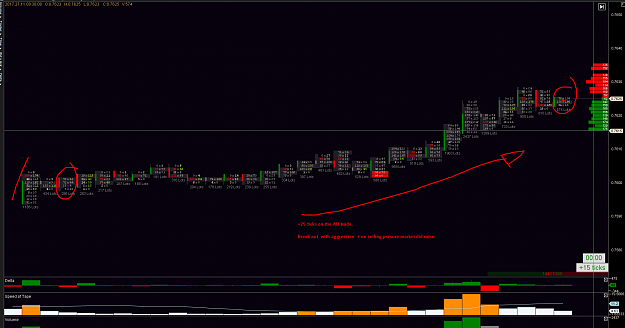
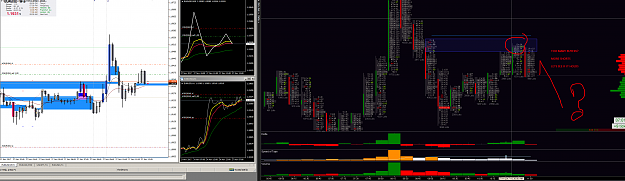
{quote} Took the short lets see if it holds. {image}
Ignored
Hi AU how's things mate ?
Well let's kick off the discussion with I agree with shorting at that moment.
But as I can see on the FP imbalance chart, in fact there are more green numbers more then red ones, doesn't this represent that they are buying. the way I understand it is if there are more buyers imbalance, the market should be strong and keep going and those would act as support points, the opposite for selling.
For example for selling it should show a big imbalance with a red number pooping preferably on the top of the ascending candle. well but I might be not exactly right if you could give me a clear picture on this matter I would be much appreciated
thanks.
{quote} Hi AU how's things mate ? Well let's kick off the discussion with I agree with shorting at that moment. But as I can see on the FP imbalance chart, in fact there are more green numbers more then red ones, doesn't this represent that they are buying. the way I was understand it is if there are more buyers imbalance the market should be strong and keep going and those would act as support points, the opposite for selling. For example for selling it should show a big imbalance with a red number pooping preferably on the top of the ascending...
Ignored
My view is that , there was a huge buy volume into the bar but price did not move much, so my view is it maybe absorption of those buy orders meaning supply is present .
{quote} My view is that , there was a huge buy volume into the bar but price did not move much, so my view is it maybe absorption of those buy orders meaning supply is present .
Ignored
You know market doesn’t like many buyers nor many sellers, and this previus zone was a big lot of sellers u can see it on my last chart.
{quote} My view is that , there was a huge buy volume into the bar but price did not move much, so my view is it maybe absorption of those buy orders meaning supply is present .
Ignored
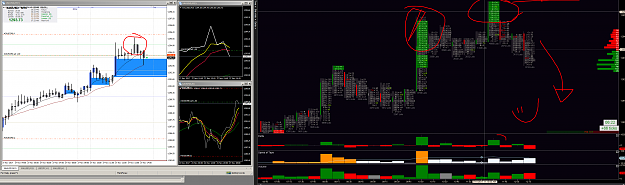
Ahh yes... makes sense now when you were saying you need to use the footprint along with other things to help confirm your analysis. In ths case using the footprint with PA you can see alot of buyers with not as much movement in PA as you'd expect, could show signs of absorbtion as you said.
I guess if we saw the same number of buyers etc on the footprint and PA actually moved further up it would be good validation of continuation up?
{quote} Ahh yes... makes sense now when you were saying you need to use the footprint along with other things to help confirm your analysis. In ths case using the footprint with PA you can see alot of buyers with not as much movement in PA as you'd expect, could show signs of absorbtion as you said. I guess if we saw the same number of buyers etc on the footprint and PA actually moved further up it would be good validation of continuation up?
Ignored
Exacly there is not a exactly science, you need to get the puzzle together .
{quote} You know market doesn’t like many buyers nor many sellers, and this previus zone was a big lot of sellers u can see it on my last chart.
Ignored
Exactly, I agree with what you say, and fully understand the concept you are describing as absorption. Although the way I see the absorption or in other words the exhaustion of the buyers, is the difference of the number of orders from the green (2nd last) bar, compared to the same top area of the red (last seen) bar. While rising it seems buyers are pushing and in fact they are that little retrace started on the 8th, and 7th bar counting backwards and continued 5th and 4th, the ones that scalped there those longs, if they entered on the 1st call for retrace they would be fine the 2nd call for confirmation of little retrace also fine they acted in sync with the smart money maneuver, but then the chasers come in on the top of the retrace and get trapped when SM money counter sells their big buy orders, right at the top where you circle removing their own buy, and, with this the buy side lost pressure and lost the backup, so market rejects and traps those that bought late... that's the way I see it. But honestly I haven't dedicated much time to analyse these charts.
Later I'll try to install market delta trial version because I will have 3 days off work so I can see live how they work and also if you are around the next 3 days we can compare the feeds and good juicy stuff.
Always remember this concepts: immediately after you buy, you become a seller on that market. and Vice-versa for sellers, Smart money sells at tops and buys at bottoms. ().
;D
Peace.
But please give me your views more in detail if you may my friend.
{quote} Exacly there is not a exactly science, you need to get the puzzle together . more buyers more sellers where when how why ... try to avoid the chart and see the flow
Ignored
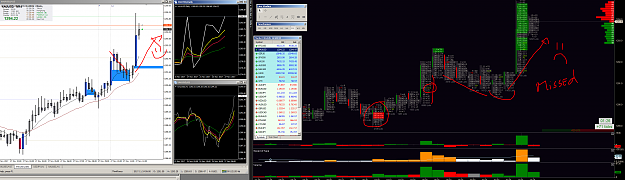
Looking like a great call my friend.
EDIT: spoke to soon although the absorbtion view at this level seems to be holding true. High volume bull candle on M1 cannot seem to break 1.19375
{quote} Hi guys how's things around This got me curious, in fact there are more footprint charts providers, I wonder if anyone is using another one of this providers other then ATAS if so , could you post a chart of the same "timeframe", same period and same market or currency, just for comparison of data, would be a good exercise. In my idea if they both use the same providers, I mean the biggest data feed providers, they all say they use more or less the same ones, then the provided footprint data should be very similar, not exactly the...
Ignored
Hi Zwara,
Sometimes it can be a level of absorption and imbalance in favor of bulls or bears. But when you see those ask orders it does not always imply that are buying, because in the exchanges the sell limit orders positioned in this same zone is translated as ask orders. And when you have too many sell limit orders the price could go down. The only ones that could see how many ask orders and sell limit orders are in a concrete case are brokers. Hope I helped you a little.
Good trading.
The best way to help the poor is not to be one of them.
...Always remember this concepts: immediately after you buy, you become a seller on that market. and Vice-versa for sellers, Smart money sells at tops and buys at bottoms. (). ;D Peace. But please give me your views more in detail if you may my friend. thanks again Peace.
Ignored
More like they go after the nearest swing highs/lows where the stops are usually clustered nearby to suck in liquidity, then run through those clustered stops just before reversing.
{quote} Hi Zwara, Sometimes it can be a level of absorption and imbalance in favor of bulls or bears. But when you see those ask orders it does not always imply that are buying, because in the exchanges the sell limit orders positioned in this same zone is translated as ask orders. And when you have too many sell limit orders the price could go down. The only ones that could see how many ask orders and sell limit orders are in a concrete case are brokers. Hope I helped you a little. Good trading.
Ignored
Hi there how are you, yes off course you did helped and please do contribute more to the thread thanks
{quote} More like they go after the nearest swing highs/lows where the stops are usually clustered nearby to suck in liquidity, then run through those clustered stops just before reversing. Look at orderflow and VSA in those areas...
Ignored
Hi there , yup you hit the spot, liquidity is the key... without it they don't make money we don't make money no one does. So yes they look at those particular areas with accumulation of order to triggers then as simple as that, it's a dirty dirty world this one .