Disliked{quote} You are right. I don't understand as I have not spent enough time on tick data as well as volume spread analysis.Ignored
What I said was: "Demand" can be read from the frequency of times a price has been used........
Unless you're conflating volume and demand. Volume is loosely related to demand. However, Volume is not a direct indication of demand. I will come back and explain the difference between volume and actual demand.
DislikedPlease enlighten us but also allow me to quote some of what you said You have no edge when you're trading using "outside info" >> I tend to disagree with this based on my limited knowledge of "price over time". This is quite the bold statement ruling out all fundamental traders who rely on news and 'outside' information to successfully trade.Ignored
While yes, both "candlesticks" and "fundamentals" are outside info……………..
I'm not sure how the topic of the thread went from "candlesticks" to "fundamentals" The use of fundamentals or candlesticks usually differentiates Traders from Investors……I can address that, in another post
DislikedWhat you are inferring is "Edge only exists in Tick Data without volume data". This can't be true in a decentralized retail FX world but probably the reason why MT4 platform does not support continuous Tick charts making it harder/impossible to reveal such an edge.Ignored
I did say "The market is reported as ticks, Price and the time in which it occurred" …...I said nothing about trading with or using tick charts
I also quoted that OHLC (live market quotes) data are not formulated into a statistically measurable and logically sound arrangement of data which provides information…..
You don't have an edge when the data you use for analysis & charting is not formulated into a statistically measurable and logically sound arrangement of data which provides information. If your data is not statistically measurable, provides no tradable info, and non representative of market generated data/info (candlesticks) you have no edge….
"Market Generated Data (MGD) is the market’s transactional data organized so that price and price-over-time are displayed. The market variables are thus price and time. Price and time are well understood; price-over-time measures value. MGD is the source of the data used for analysis. When one plots price against time, it is clear which prices are most traded, i.e. are most popular and valued.
Transactional data comes in the form of ‘ticks’. A tick is created at each price change. Trading at a given price will not generate a tick. A tick carries two pieces of information, price and time when it occurred. Throughout the trading day, there is a steady stream of ticks. The simplest way to present tick action is in a bar chart with equidistant times or in a point figure chart. Neither are ‘market generated data’ because MGD must display price and time".- Donald L. Jones CISCO-Futures
Attached Image (click to enlarge)
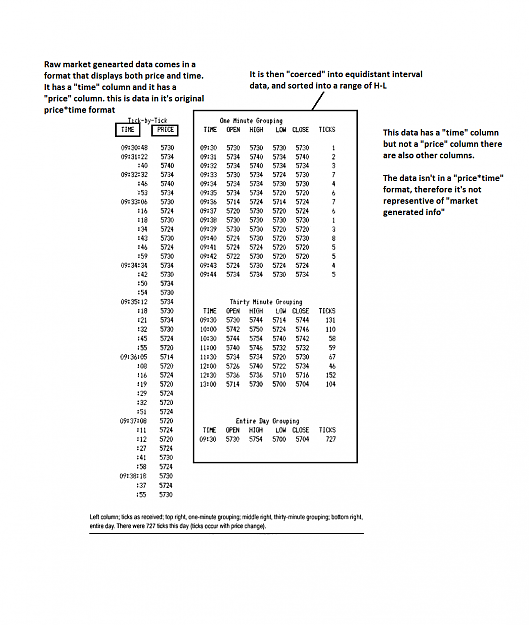
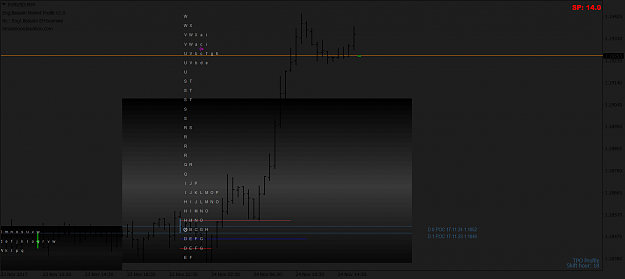
If the only data you have available to you is OHLC what you need to do is "un coerce"/reformat the data back into a market generated format. Data that has both a "price" column and a column that marks "time".
My diagram was an example how to reformat OHLC into it a market generated price*time format for analysis……………..
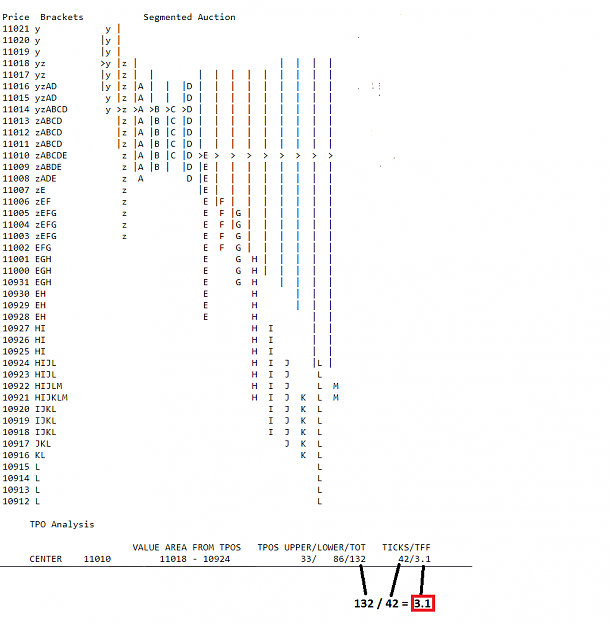
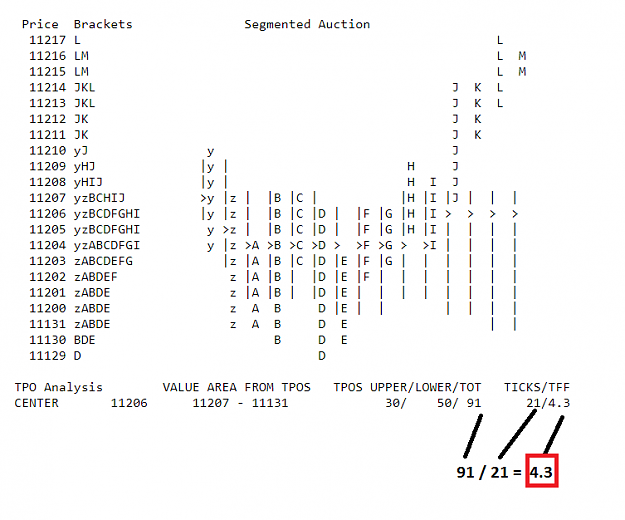
All we need to know that during a 30m segment of time that price was used. It doesn’t matter if the same price was quoted 150 times during that 30m segment of time it still counts as 1 tpo/time price event. Frequency "Counts" of each time a price is used
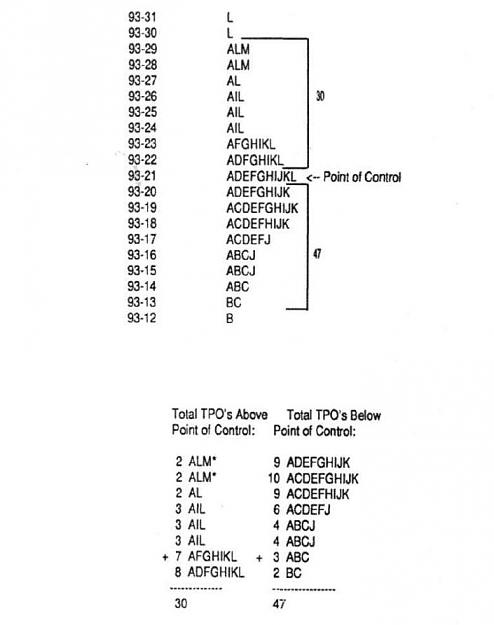
By breaking the market into it's components/units: TPO's... "price*time events", "time price opportunities", "time that price occurred" , all the same. You now have a data set that is quantifiable & measureable is unbiased by observer TF (objective data).
Every time a price is "used"/quoted is an opportunity for trade. By breaking the data into tpo/events you have equal, quantifiable, "units of measure" for analysis……...
Frequency "Counts" of each time a price is used over time Gives you a single multidimensional distribution/display of prices .
"Demand" can be read from the frequency of times a price has been used........
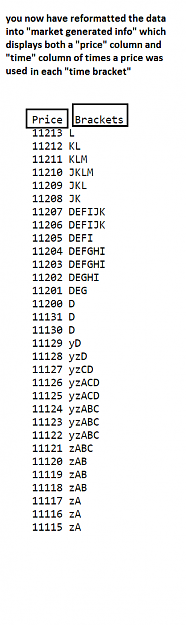
By keeping a tally/count how many times a "price" is used at each 30m interval your data now has a "price" column and you have a count of the "times" a price was used in a "time" column. you have then restored your data to it's original market generated Price*time format. Now you have a display of MGD that displays both price and time in which you can now use for analysis….
Attached Image (click to enlarge)
Markets are not efficient, rather they are effective - Jones
1