{quote} Can't agree more bro.. on my chart 1.1769-1.1781 zone is good for sell setup.. For today I believe bulls will mostly lead but starting from tomorrow we might get back to bearish.. but of course this is a rough guess.. for now what is important is to ride the bullish move and keep buying dips.. Stay Green
Ignored
True bro.. Bull pressure ATM
I will wait for the next hour close and decide what to do with my new short..
Always crazy till the big news...
{quote} Can't agree more bro.. on my chart 1.1769-1.1781zone is good for sell setup.. For today I believe bulls will mostly lead but starting from tomorrow we might get back to bearish.. but of course this is a rough guess.. for now what is important is to ride the bullish move and keep buying dips.. Stay Green
Ignored
Hi there, nice one, Ata! I'd extend to 1.1769 - 1.1800 zone for sell
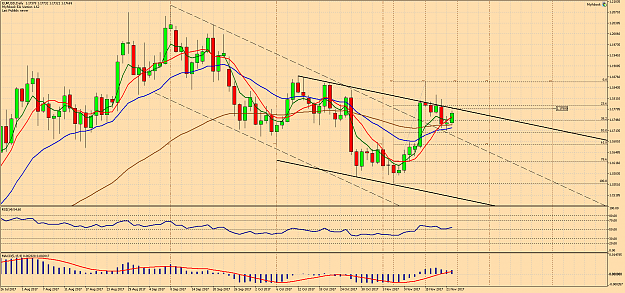
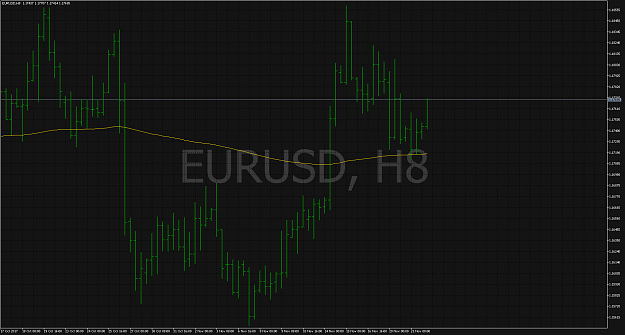
4hr chart long signal at 1.1739 take profit is a little bit under the weekly high 1.1830. I'm gonna monitor the position once it get to 1.1760 as I feel there's a support level there that must be passed before I have any real hopes of it going to my Tp if it is resistant then I'll close my position with a young 20 points in the bag. {image}
Ignored
I also see like this. But i strongly believe and my intuition is saying:
-at that is a fake signal,
- IS still time for the H4 calnde to run.
- If the candle doesnt close above the Blue Line form me is a fake signal.
I opened a sell at 17668 no sl TP 17164 But i can also close it manually
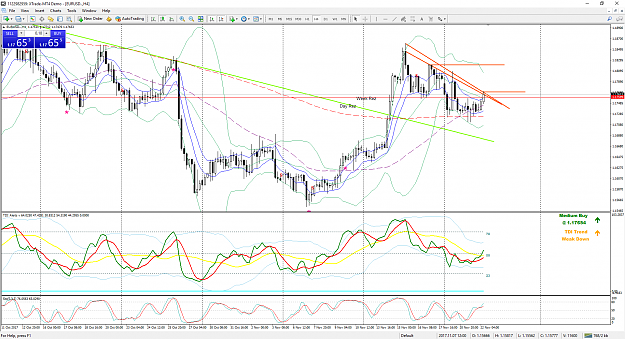
{quote} I also see like this. But i strongly believe and my intuition is saying: -at that is a fake signal, - IS still time for the H4 calnde to run. - If the candle doesnt close above the Blue Line form me is a fake signal. I opened a sell at 17668 no sl TP 17164 But i can also close it manually {image}
Ignored
Hi
Even if the USdollar looks weak because the correlation with JPY, Gold, Oil, stocks, the 1.1766 level looks good for a sell
because FOMC use to paralyze EUR/USD wide movements.
Good luck with that !
Guys please we got a bullish doji on daily it is almost 100% sure that we finish with a nice bullish candle. Sells are very risky.
Ignored
I respect your warning mate.. thanks..
Imho, for now my thinking is that as long as M30 candles close below 1.1782 or as soon as one candle closes above it and the next candle closes back below (such that are reflecting a doji candle on H1 timeframe) selling would be profitable. But once I see clear candle open and close above this level I would stop selling.
1.1769 showed some rejection already.. At this stage (based on M30) there is no strong evidence of bears yet.. but we wait until candles come closer to 1.1780/90 area.. that's where I expect some reaction.. let's wait and see..
{quote} I also see like this. But i strongly believe and my intuition is saying: -at that is a fake signal, - IS still time for the H4 calnde to run. - If the candle doesnt close above the Blue Line form me is a fake signal. I opened a sell at 17668 no sl TP 17164 But i can also close it manually {image}
Ignored
My 30min chart suggests that there might be a possible reversal but I'd stay away from shorts as long as we are above 1.1754. in fact I'd start looking to short if it goes 10 points lower than that. But for now I'm more towards longs.
I'm a 23 year Old South African Eager To Learn & Contribute.
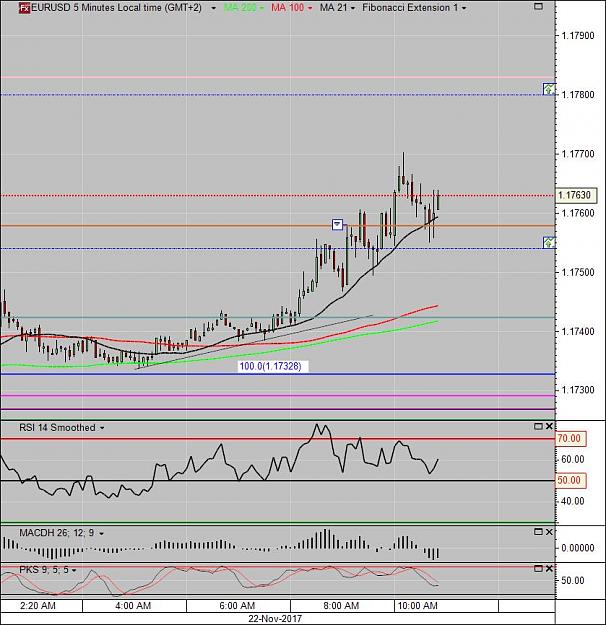
{quote} My 30min chart suggests that there might be a possible reversal but I'd stay away from shorts as long as we are above 1.1754. in fact I'd start looking to short if it goes 10 points lower than that. But for now I'm more towards longs.
Ignored
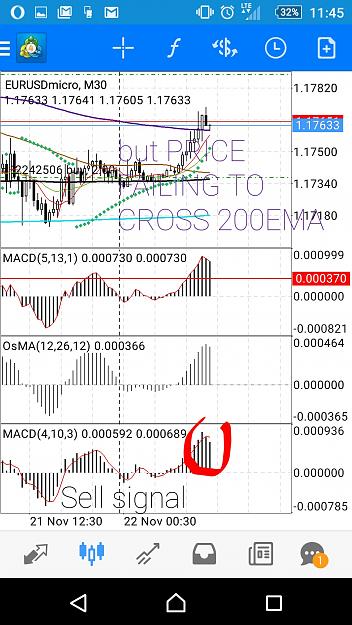
Just to add on what I was saying. There's a sell signal on the 30 min chart but the price hasn't crossed any of my moving averages even the closest one (200Ema) suggesting that this is a very low probability trade. Hense I'm staying away from shorts for now..
Attached Image (click to enlarge)
I'm a 23 year Old South African Eager To Learn & Contribute.
{quote} Just to add on what I was saying. There's a sell signal on the 30 min chart but the price hasn't crossed any of my moving averages even the closest one (200Ema) suggesting that this is a very low probability trade. Hense I'm staying away from shorts for now.. {image}
Ignored
On this 4H close, I do agree with your sell idea.. holding a tiny one myself..
Nice to see your post from my current base lol
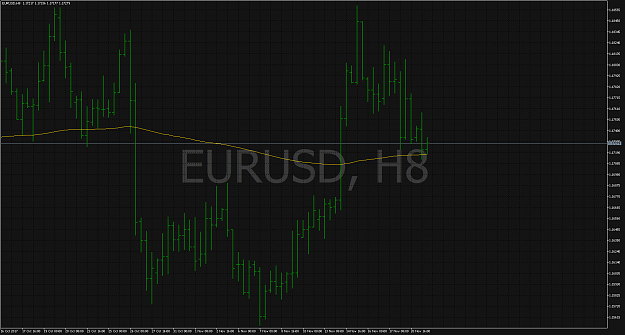
My Intraday Outlook. (ahead London) Apparently the main trend is still bearish ...but bears look tired since the sideways consolidation yesterday. Possibly a bull turn. - It looks like the little bull now has to push strong the 1.1760-63 resistance area if it wants to continue (bearish TL + Monthly-mid+Weekly_Pivot...) - I think I'll short...
Ignored
Finally, ...a little down!
Thank FXGod, I was about to lose more than I can afford for a single day!