my logic and draw I’m using from long time ago
today I don’t markt will go more highly 1.1860 zoon
dont buy more today market or tomorrow market will start fall in December we will see 1.14
again market will not go at1.1860 we will see new low end of week or next week best of luck
Joined May 2014
|
Status: Full Time Trader
|27,331 Posts
When looking at my M30 chart:
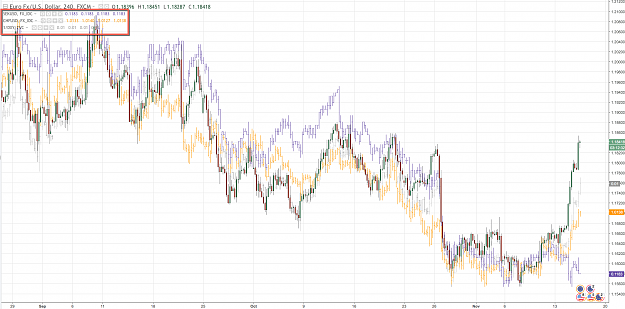
Highest high of today was 1.1852... the tiny first retest to achieve a new higher high failed, which keeps the highest swing low still at 1.1784 (not like many would believe at: 1.1828, that is not a swing low yet.. only after a new high it will become a swing low)
That being said I will still try to buy the swing lows. Not at 1.1828 though. Just as mentioned above, I will look to buy again around 1.1780/90 area.
When looking at my M30 chart: Highest high of today was 1.1852... the tiny first retest to achieve a new higher high failed, which keeps the highest swing low still at 1.1784 (not like many would believe at: 1.1828, that is not a swing low yet.. only after a new high it will become a swing low) That being said I will still try to buy the swing lows. Not at 1.1828 though. Just as mentioned above, I will look to buy again around 1.1780/90 area. Stay Green
When looking at my M30 chart: Highest high of today was 1.1852... the tiny first retest to achieve a new higher high failed, which keeps the highest swing low still at 1.1784 (not like many would believe at: 1.1828, that is not a swing low yet.. only after a new high it will become a swing low) That being said I will still try to buy the swing lows. Not at 1.1828 though. Just as mentioned above, I will look to buy again around 1.1780/90 area. Stay Green
Ignored
I'm lost (once again). My daily chart screams 'sell'. everything is 'overbought'. but 30 min looks like it goes more up soon...?
I had the 1.1784 on my chart too. but shouldn't a break rather be a reason to sell? (sorry trying to understand and learn)
cheers
{quote} I'm lost (once again). My daily chart screams 'sell'. everything is 'overbought'. but 30 min looks like it goes more up soon...? I had the 1.1784 on my chart too. but shouldn't a break rather be a reason to sell? (sorry trying to understand and learn) cheers
Ignored
It probably will go up further, don't count on the daily for timing.
But we are at a good level to think about shorting. It's all about timing.
We might see 187xx.
|
Joined Jul 2017
|
Status: Analyst, Self-Examinator
|264 Posts
Hi All,
theory: they will kill the stops above 1.187x, so I expect at least a spike with a new high, some consolidation and a wave to a new high which will fail(bull trap) and it will fall back below 1.18.
target: consolidation of this 250 PIP rise or whatever was it, to 1.174x
Limit sell: 1.1875 and 1.1890
Stop: 1.1930
Target: 1.1765
{quote} I'm lost (once again). My daily chart screams 'sell'. everything is 'overbought'. but 30 min looks like it goes more up soon...? I had the 1.1784 on my chart too. but shouldn't a break rather be a reason to sell? (sorry trying to understand and learn) cheers
Ignored
Yes.. your questions make sense.. but first of all I didn't say I will surely buy at 1.1780/90 area. I said: I will "LOOK" to buy. Looking to buy means you want to re-analyse the situation at that very moment and at that area to see if it is worth to buy or not.
Generally in such a strong trend situation one last buy wouldn't hurt and if that support level breaks I would either leave with a BE or a tiny loss or at worst I would get stopped out with a 16 pips SL I generally prefer at these areas so what? Next trades would then be sell trades.
Because there are so many things I have to leave out when I share something, readers have to be aware of the basic rules of trading in the first place. I always do my best to explain and give away my reasoning but inside the goals of the "EURUSD Only" thread, in my humble thinking, this is not the perfect place to give detailed information for every thought I share. I neither have the time for it nor the will and most of the members here wouldn't even want to see "educational" material flooding all over the pages. So please keep learning from other sources too and mostly try to grasp the effect of support and resistance areas and timing a trade.
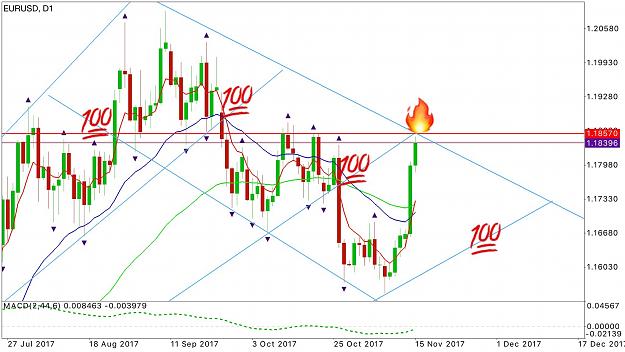
I would ignore the H/S are starting looking for a descedent channel. if it fails @ 1.1844 after the data, i will look for @1.17
if not, it's open road to close the gap @ 1.1944
i will stay out for now and make a decision after the data
Big news today in 30 minutes. US CPI/CORE CPI. November the past 2 years has seen a tick up in CPI, and last month was the largest print since at least 2014. Judging by what we saw yesterday (a .4 print of PPI) I'm expecting an inline or better CPI print.
Im sure @mbrown is leaning towards an overshoot like he was the PPI considering the expectation is a meager .1%....I'm inclined to agree. All things considered .2%-.4% is my forecast.
As I'm pretty sure everyone in the thread agrees....technically this is a make or break point for the bears....they need a good print.
*retail unless a massive undershoot is not important today
Alright alright! Look alive 'gents! Big news today in 30 minutes. US CPI/CORE CPI. November the past 2 years has seen a tick up in CPI, and last month was the largest print since at least 2014. Judging by what we saw yesterday (a .4 print of PPI) I'm expecting an inline or better CPI print. Im sure @mbrown is leaning towards an overshoot like he was the PPI considering the expectation is a meager .1%....I'm inclined to agree. All things considered .2%-.4% is my forecast. As I'm pretty sure everyone in the thread agrees....technically this...
Ignored
i also expect a 0.2% to 0.4% increase. wich is more then forecasts
Daily chart: The unorthodox trendline has potential upside movement being capped at approximately 1.1880. I'm quite excited by what will transpire in 55 minutes time. 13:09 - Just to clarify a point about the H&S I posted earlier because it maybe a little misleading. The orthodox technical view is the H&S already failed at point A when the price breached the neck-line. Back in the day a breach of the neckline was relatively uncommon however in today's markets a breach of the neckline is 50/50. The unorthodox view is H&S failure is confirmed after...
No overshoot- but inline none the less Expecting December FOMC interest rate hike no question, as will the market. Failure to hike will be a bombshell http://www.cmegroup.com/trading/inte...-to-fomc.html/ I'll check in later today- good luck all!
I missed most of this move up, was busy with other things. I am still seeing irrational exuberance for this pair so will look to get long again but at much lower price, in the 1.1710 area. Not sure what the market is going to do next so I will just observe
just my thoughts about what can happen; I would ignore the H/S are starting looking for a descedent channel. if it fails @ 1.1844 after the data, i will look for @1.17 if not, it's open road to close the gap @ 1.1944 i will stay out for now and make a decision after the data happy trading {image}
Ignored
Short @1.1854 SL already B/E
as I mention maybe 1.17... right now TP @ 1.179 . it might change depends on PA