Hi Damian,
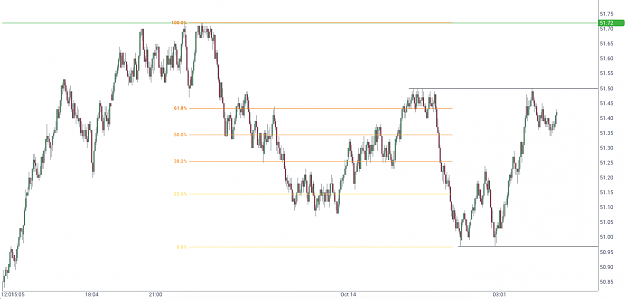
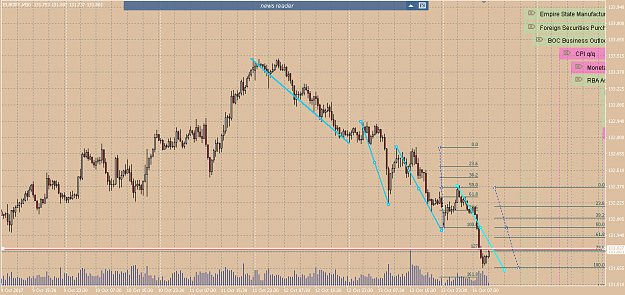
This is a 600 tick CL chart and it looks like a perfect correction back to the 51.50 after a double bottom/V pattern. Is the expectation to enter short again because longer term NSL is still intact?
This is a 600 tick CL chart and it looks like a perfect correction back to the 51.50 after a double bottom/V pattern. Is the expectation to enter short again because longer term NSL is still intact?
Attached Image (click to enlarge)