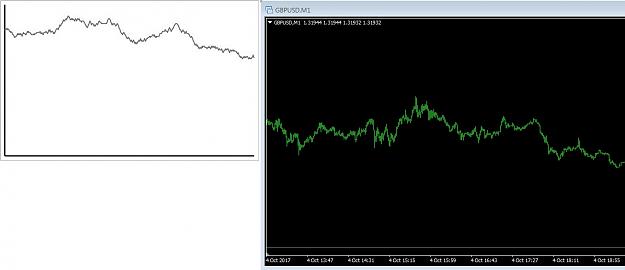
Disliked"The smallest time unit between changes in the price of any currency pair is called a single tick, and a sequence of consecutive ticks is referred to as streaming data. During period of heavy trading, there may be as many as three hundred ticks in a single minute. Conversely, during periods of low trading (such as in certain minor currency pairs over the weekend), several hours can elapse between individual ticks. Tick data does not have an open, high, low, or close quote it simply tells the previous price. The OHLC quotes occur only after tick...Ignored
In other words this is momentum; but momentum is not a constant, so it can give clues about direction that are very short living as momentum can vary very fast. A shift in momentum does not mean necessarily a change in direction.
For sure you can trade momentum but it is just a way between many others.
The key is first to understand "the why of things", thereafter you will be able to do whatever you want getting consistent results anyway; what is "the why?" it is the cause: on your charts you can see only the effect, whatever kind of analysis you can point out you are analysing only the effect. Find the cause and understand it, this is the only analysis you need.