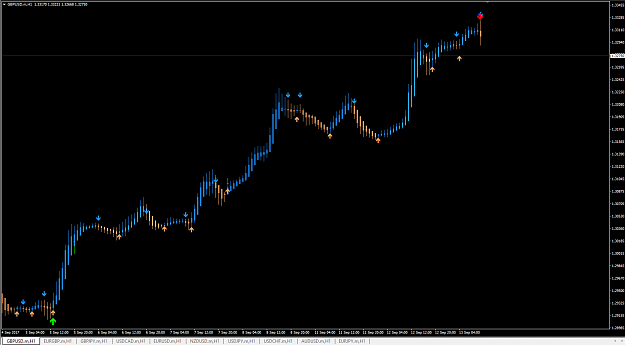
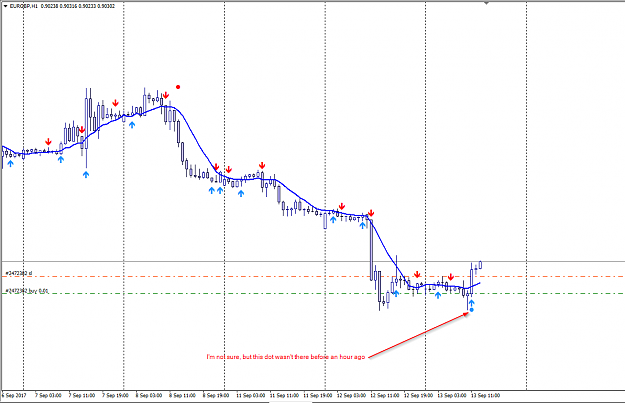
DislikedPerhaps we can take signals on 1H time-frame, also when the small arrow appears in one candle and then the big arrow appears in the following candle, or one after that, i.e 1 or 2 candles after the small arrow. Also, it seems that taking buy signal from support area, and sell signal from resistance area - works great! Here is an example that shows a small buy arrow in a candle, then a big arrow appears 2 candles later. (red ractangle) Please note the support area, marked with a white line. Then price just took off... {image}Ignored
Thank you Inner!
We can work together and improving this, i think with 1-2 indicators of volumes and momentum and pivots + highest/lowest of the day and ADR it will be very good
![Click to Enlarge
Name: 2017-09-12 17_51_14-120140580_ FXOpen-ECN Demo Server - Demo Account - [USDCAD,H1].png
Size: 32 KB](/attachment/image/2477990/thumbnail?d=1505253645)