Bookmark Thread
Print Thread
TheChalleger's Journal - My Trading Journey 467 replies
DU23 Journal of a journey? 18 replies
zulemara's trade journal...A "magical" journey to wealth 6 replies
Mikali’s Journal – My Trading Journey Using the James16 Methodology 15 replies
MY Journey's Journal 11 replies
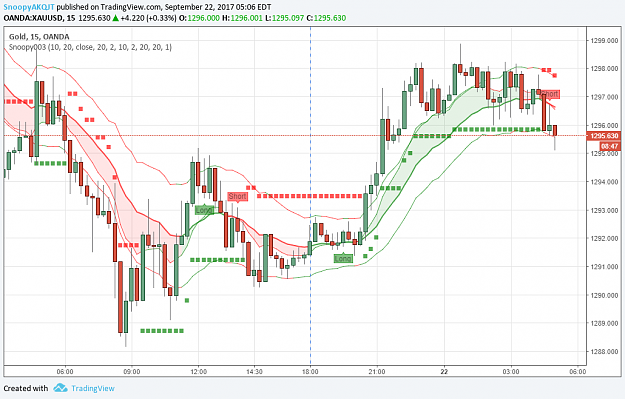
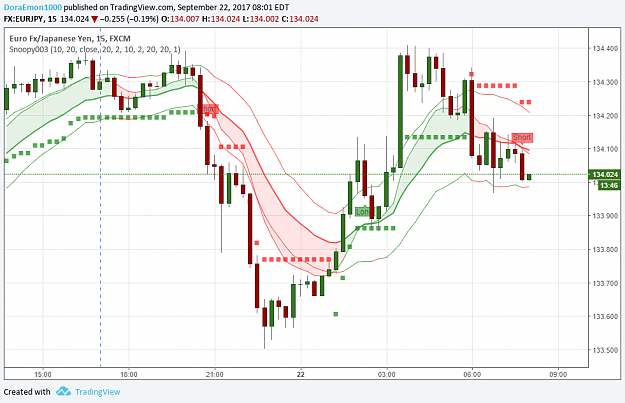
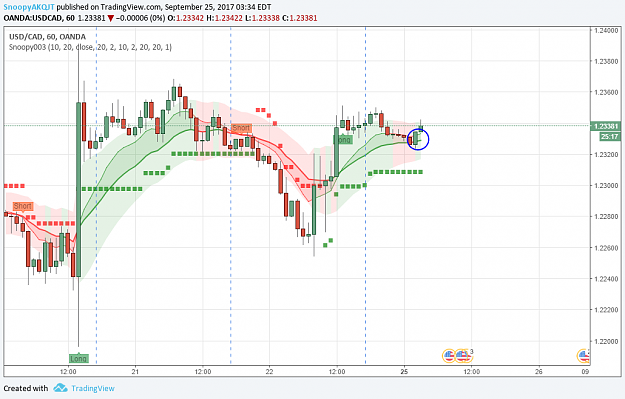
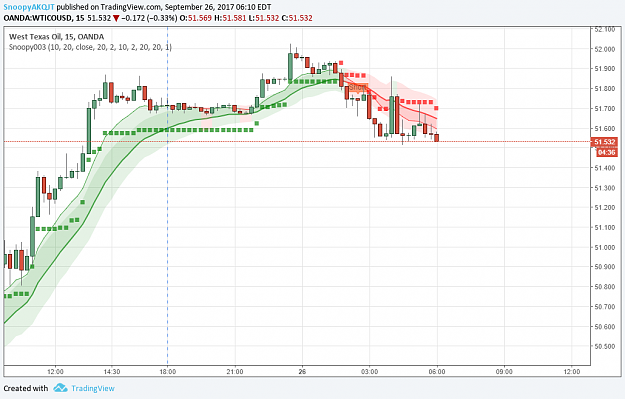
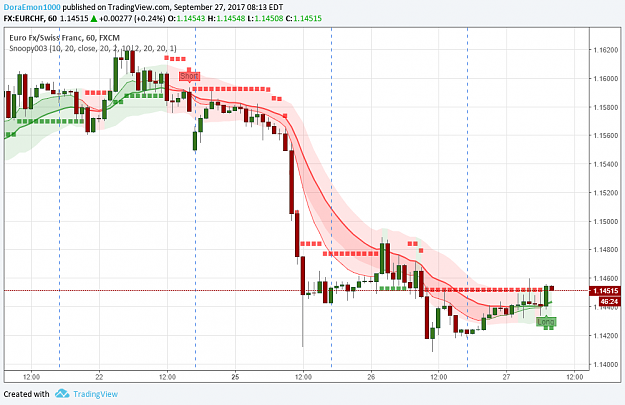
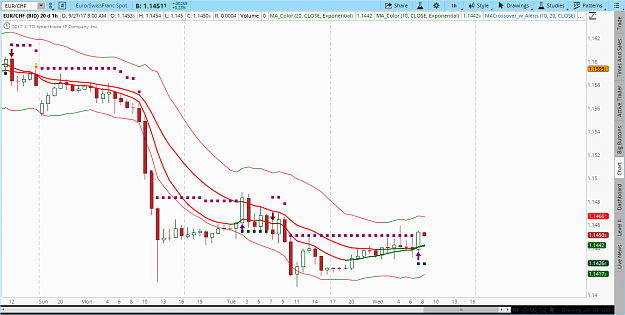
study(title="Snoopy003 MA KC ATR",overlay = true, shorttitle="Snoopy003")
inp1stMA = input(10, title="1stEMA-Fastest", type=integer)
inp2ndMA = input(20, title="2ndEMA-Slow", type=integer)
EMA1 = ema(close, inp1stMA)
EMA2= ema(close, inp2ndMA)
// Define colors for the MAs
co1 = EMA1[1] > EMA1[2] ? green : EMA1[1] < EMA1[2] ? red : yellow
co2 = EMA2[1] > EMA2[2] ? green : EMA2[1] < EMA2[2] ? red : yellow
// Plot the MAs
Plot1=plot (EMA1, color = co1, linewidth = 1, title = "1stEMA")
Plot2=plot (EMA2, color=co2, linewidth=2, title='2ndEMA')
fill(Plot1,Plot2,co2,transp = 90)
// MA Ribbon crossover
MAbear = (EMA1<EMA2) and not (EMA1[1]<EMA2[1])
MAbull = (EMA1>EMA2) and not (EMA1[1]>EMA2[1])
// Plot buy sell signals based on MA ribbon
plotshape(MAbull,"MAbull",shape.labelup,location.belowbar,green,text="Long",textcolor=black,transp=50)
plotshape(MAbear,"MAbear",shape.labeldown,location.abovebar,red,text="Short",textcolor=black,transp=50)
// ATR Trailing Stop
SC = input(close,"ATR data array",source) // data array
// Fast Trail //
AP1 = input(20,"fast ATR period",integer) // ATR Period
AF1 = input(2,"fast ATR multiplier",float) // ATR Factor
SL1 = AF1*atr(AP1) // Stop Loss
Trail1 = iff(SC>nz(Trail1[1],0) and SC[1]>nz(Trail1[1],0),max(nz(Trail1[1],0),SC-SL1),
         iff(SC<nz(Trail1[1],0) and SC[1]<nz(Trail1[1],0),min(nz(Trail1[1],0),SC+SL1),
         iff(SC>nz(Trail1[1],0),SC-SL1,SC+SL1)))
// Slow Trail //
AP2 = input(10,"slow ATR perod",integer) // ATR Period
AF2 = input(2,"slow ATR multiplier",float) // ATR Factor
SL2 = AF2*atr(AP2) // Stop Loss
Trail2 = iff(SC>nz(Trail2[1],0) and SC[1]>nz(Trail2[1],0),max(nz(Trail2[1],0),SC-SL2),
         iff(SC<nz(Trail2[1],0) and SC[1]<nz(Trail2[1],0),min(nz(Trail2[1],0),SC+SL2),
         iff(SC>nz(Trail2[1],0),SC-SL2,SC+SL2)))
// Plot ATR Stop
//TS1 = plot(Trail1, style = circles)
//TS2 = plot(Trail2, style = line, color=SC>Trail2? green : red, linewidth=2)
//fill(TS1,TS2,Bull ? green : red,transp = 90)
plotchar(Trail1,char="■",location=location.absolute,size=size.tiny,
         title="StopLoss",color=SC>=Trail1?green:red)
// Keltner Channels
KClength = input(20, minval=1, title = "KC EMA Length")
KCatrlen = input(20, minval=1, title = "KC ATR Length")
KCmult = input(1.0, title="KC Multiplier")
KCma = ema(close, KClength)
KCtruerange =  tr
KCrangema = ema(KCtruerange, KCatrlen)
KCupper = KCma + KCrangema * KCmult
KClower = KCma - KCrangema * KCmult
KCcol1 = KCupper[1] > KCupper[2] ? green : KCupper[1] < KCupper[2] ? red : yellow
KCcol2 = KClower[1] > KClower[2] ? green : KClower[1] < KClower[2] ? red : yellow
pKC1=plot(KCupper, color=na, title="UpperKC")
//plot(KCma, color=KCco1, title="MidKC")
pKC2=plot(KClower, color=na, title="LowerKC")
fill(pKC1,pKC2,color=KCcol1)
// End of Script Snoopy03