• Home
  • Forums
  • Trades
  • News
  • Calendar
  • Market
  • Brokers
  • Login
  • Join
  • 2:49am
Menu
  • Forums
  • Trades
  • News
  • Calendar
  • Market
  • Brokers
  • Login
  • Join
  • 2:49am
Sister Sites
  • Metals Mine
  • Energy EXCH
  • Crypto Craft

Options

Bookmark Thread

First Page First Unread Last Page Last Post

Print Thread

Similar Threads

The $20 Dollars a Day Methodology using Nadex products 50 replies

My Dax Trading Journey Using 123, 2b and Market Structure 9 replies

Sharing my trading methodology 10 replies

Trading system/methodology to share 12 replies

My Trading Methodology 13 replies

  • Trading Journals
  • /
  • Reply to Thread
  • Subscribe
  • 9
Attachments: Mikali’s Journal – My Trading Journey Using the James16 Methodology
Exit Attachments
Tags: Mikali’s Journal – My Trading Journey Using the James16 Methodology
Cancel

Mikali’s Journal – My Trading Journey Using the James16 Methodology

  • Post #1
  • Quote
  • First Post: Oct 19, 2009 7:18pm Oct 19, 2009 7:18pm
  •  Mikali
  • | Joined Mar 2008 | Status: Student - School of Hard Pips | 127 Posts
Welcome to my journal and my trading journey.

I have been reading the James16 Chart thread for some time and I cannot help but be astonished at the straightforward yet logical trading methodology presented by James16 and his supporters.

The first thing I noticed as I dug deeper into the James16 chart thread, was that unlike other threads, this was not a trading “system” but rather a sound trading methodology using price action with support and resistance as its backbone.

The intention of this journal is twofold. Firstly, it will be a place where I will record my trades (winners and losers) with my initial analysis and thoughts. Secondly, this journal with any luck and with the help of the FF community provide feedback and healthy discussions on the trades so that others and I may learn and grow in our trading journeys.


Cheers,
Mikali
  • Post #2
  • Quote
  • Oct 19, 2009 7:24pm Oct 19, 2009 7:24pm
  •  Mikali
  • | Joined Mar 2008 | Status: Student - School of Hard Pips | 127 Posts
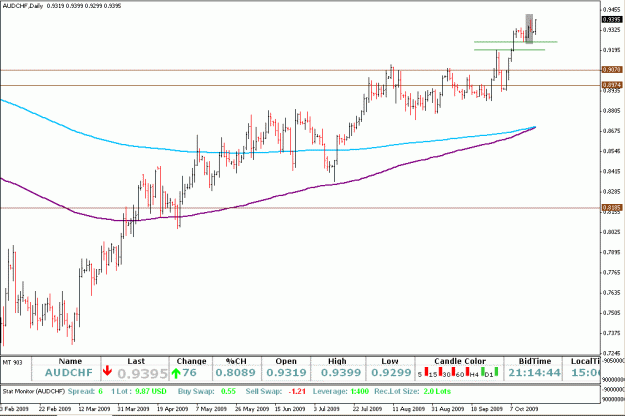
Daily PB AUDCHF

Why I took the trade:
The Pin Bar developed at a swing high with its nose near a round number 0.9400 and its tail just above the consolidation’s resistance area. The Daily, Weekly and Monthly trends were upward although on the Weekly chart a Doji just above the 200 EMA appeared showing indecision. On the Daily chart the Pin Bar emerged after a brief consolidation that commenced October 8th. Since the Pin Bar appeared in a traffic area I anticipated some areas where price might stall the first appeared at 0.9245 (support area formed by the recent consolidation).
The second area where I thought price would stall would be 0.9200.

The Trade:

Sell Stop @ 0.9330
S/L @ 0.9404
T/P 1 @ 0.9250
T/P 2 @ 0.9200


Trade Result:

Trade was stopped out with a loss.

I look forward to your thoughts and comments.

Cheers,
Mikali
Attached Image (click to enlarge)
Click to Enlarge

Name: AUDCHF 19-Oct-09.gif
Size: 23 KB
 
 
  • Post #3
  • Quote
  • Oct 19, 2009 7:30pm Oct 19, 2009 7:30pm
  •  Mikali
  • | Joined Mar 2008 | Status: Student - School of Hard Pips | 127 Posts
Hi Folks,

I also posted this trade over on the James16 thread to get some feedback and mbqb11 aka Mike posted the following reply:

"Again to me personally(and again everyone can disagree I can only share my experiences), this is again a small pin in relation to this strong moves were having. You have it so closed to nailed here. If you just take this exact scenario and wait for a bar that smacks you in the face, instead of just a bar that meets the technical criteria to be a pinbar, there is nothing that can prevent you from making money consistently."

A big thanks to Mike for his insight!!

Mikali
 
 
  • Post #4
  • Quote
  • Oct 19, 2009 9:21pm Oct 19, 2009 9:21pm
  •  mseaz9
  • | Joined Aug 2008 | Status: Member | 156 Posts
Best of luck mate.
 
 
  • Post #5
  • Quote
  • Oct 19, 2009 9:30pm Oct 19, 2009 9:30pm
  •  Mikali
  • | Joined Mar 2008 | Status: Student - School of Hard Pips | 127 Posts
Quoting mseaz9
Disliked
Best of luck mate.
Ignored
Thank you for your kind wishes!!

Mikali
 
 
  • Post #6
  • Quote
  • Oct 19, 2009 9:44pm Oct 19, 2009 9:44pm
  •  mseaz9
  • | Joined Aug 2008 | Status: Member | 156 Posts
no probs.
 
 
  • Post #7
  • Quote
  • Oct 20, 2009 6:45am Oct 20, 2009 6:45am
  •  Mikali
  • | Joined Mar 2008 | Status: Student - School of Hard Pips | 127 Posts
Good Morning,

I placed the details of this trade on the James16 chart thread as well.

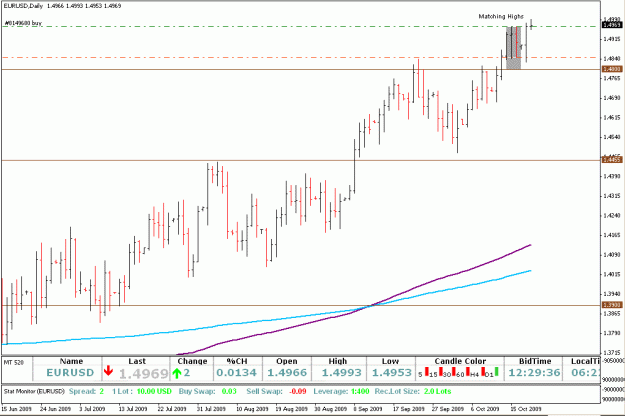
On Sunday I placed a trade on the EURUSD based on a price action pattern that is seldom discussed that is matching highs. The basis for taking this trade was that the EURUSD was trending upwards and the matching highs represented a possible trend continuation breakout.

The highs of the bars acted as support dating back to August 2008. The trade triggered just before Mondays New York close and interestingly the Monday bar formed a BUOB as FX_Serg pointed out a few posts back. Now I realize that BUOB to be a valid trade signal should appear at swing lows but I believe in this case it suggests that the EURUSD may continue to trend upwards.

Would anyone like to comment on this trade I appreciate any and all feedback.

Cheers,
Mikali
Attached Image (click to enlarge)
Click to Enlarge

Name: EURUSD 20-Oct-09.gif
Size: 23 KB
 
 
  • Post #8
  • Quote
  • Oct 20, 2009 8:28am Oct 20, 2009 8:28am
  •  Mikali
  • | Joined Mar 2008 | Status: Student - School of Hard Pips | 127 Posts
I received two excellent observations on this trade over at the James16 chart thread by 2 posters:

First nasir.khan observed that on the weekly chart of the EURUSD there was strong resistance at the 1.5000 price point that I failed to see.

Second supremeChaos noted that should price reach the 1.5000 price point that price only really has three options:
1) break upward
2) reverse downward
3) consolidate at 1.5000 then break up or down

Taking into consideration these observations I am adjusting my trade plan as follows: My initial TP was set at 1.5100 so now I plan on taking half profits at the 1.5000 and moving my SL to break even on the remaining position.

My thanks to nasir.khan and supremeChaos for there insights!!

Mikali
 
 
  • Post #9
  • Quote
  • Oct 20, 2009 4:07pm Oct 20, 2009 4:07pm
  •  Mikali
  • | Joined Mar 2008 | Status: Student - School of Hard Pips | 127 Posts
Hi Folks,

Thus far this trade is not working out as I had planned. mbqb11 (Mike) has provided some fantastic insight into this trade over at the James16 chart thread that I think is very beneficial.

http://www.forexfactory.com/showpost...ostcount=46452

This is a very good lesson in managing a trade and knowing when to move SL to break even around important psychological levels.

Cheers,
Mikali
 
 
  • Post #10
  • Quote
  • Oct 21, 2009 11:42am Oct 21, 2009 11:42am
  •  Mikali
  • | Joined Mar 2008 | Status: Student - School of Hard Pips | 127 Posts
Hi Folks,

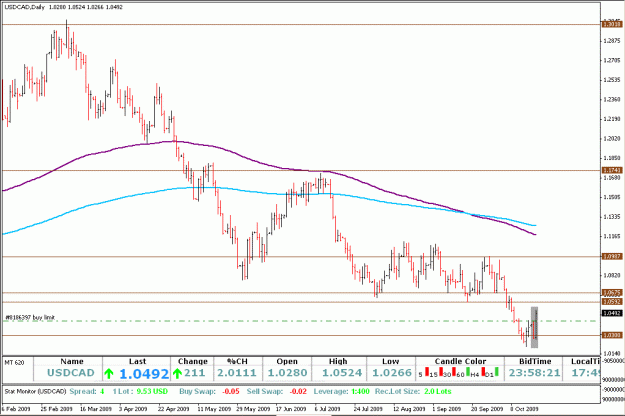
I wanted to share with you a trade I put on late last night that never materialized - the USDCAD DBLHC on the daily chart.

Why I Placed the Trade:
The DBLHC developed at a PPZ 1.0300 which was tested a number of times in recent days. Prior to price moving down to the PPZ it was stuck in a channel since mid July. The idea was that price would test the channel's support which was now resistance.

The Trade:
My trade plan was to enter on a 38 Fib retracement of the BUB of the pattern.

Buy Limit Order @ 1.0425
SL @ 1.0300 the PPZ
TP 1 @ 1.0590
TP 2 @ 1.0675

I cancelled the order earlier today when price failed to retrace to the 38 Fib before breaking the high of the BUB - which made the R:R imprudent.

benji533 over at the James16 chart thread pointed out the risky nature of this trade by trading long into strong resistance.

http://www.forexfactory.com/showpost...ostcount=46491

The lesson here as pointed out by benji533 is careful not to trade PA set-ups blindly. As the saying goes "never trade long into resistance or trade short into support".

benji533 pointed out the safer trade plan was to wait for price to reach the PPZ around 1.0675 and look for price action on a short trade.

Below are the before and after charts for the trade. If anyone else has any further comments or analysis I would love to hear it.

Thanks,
Mikali
Attached Image(s) (click to enlarge)
Click to Enlarge

Name: USDCAD 20-Oct-09.gif
Size: 23 KB
Click to Enlarge

Name: USDCAD 21-Oct-09.gif
Size: 23 KB
 
 
  • Post #11
  • Quote
  • Oct 21, 2009 2:54pm Oct 21, 2009 2:54pm
  •  Mikali
  • | Joined Mar 2008 | Status: Student - School of Hard Pips | 127 Posts
Quoting Mikali
Disliked
Hi Folks,

Thus far this trade is not working out as I had planned. mbqb11 (Mike) has provided some fantastic insight into this trade over at the James16 chart thread that I think is very beneficial.

http://www.forexfactory.com/showpost...ostcount=46452

This is a very good lesson in managing a trade and knowing when to move SL to break even around important psychological levels.

Cheers,
Mikali
Ignored
Hi Folks,
Its not often you get a second shot at managing a trade that initially goes against you but, that's exactly what happened here. After price rejected the 1.5000 price point as mbqb11 (aka Mike) explained in here: http://www.forexfactory.com/showpost...ostcount=46452
I was looking at a huge draw down. Initially, I was very worried but then I said to myself there are still buyers because price never broke below the lows of the matching highs. I patiently waited for price to break the highs and then moved my SL to BE. To make a long story short I was able to bank 24 pips before I was stopped out.

What's the lesson here? I believe primarily, we as traders need to understand that to become successful we just cant identify price action patterns and enter a trade without first looking at what price is doing and where its doing it. In this case price was slowed by the 1.5000 psychological price point.

Secondly, as Mike alluded there are many other things to take into consideration such as trade management, trader psychology and market behaviour just to name a few.

This was a great learning experience and I hope others can benefit as well.

Cheers,
Mikali
Attached Image (click to enlarge)
Click to Enlarge

Name: EURUSD 21-Oct-09.gif
Size: 22 KB
 
 
  • Post #12
  • Quote
  • Oct 22, 2009 5:41am Oct 22, 2009 5:41am
  •  nasir.khan
  • Joined Apr 2009 | Status: Member | 2,891 Posts
Your goin nice BRO all the best.
 
 
  • Post #13
  • Quote
  • Oct 22, 2009 12:08pm Oct 22, 2009 12:08pm
  •  Mikali
  • | Joined Mar 2008 | Status: Student - School of Hard Pips | 127 Posts
Quoting nasir.khan
Disliked
Your goin nice BRO all the best.
Ignored
Hi nasir.khan,

Thank you kindly for the encouragement!! I know with the help of the veteran traders such as yourself this will be a long journey but at the same time a very fulfilling one.

Best Regards,
Mikali
 
 
  • Post #14
  • Quote
  • Oct 22, 2009 7:21pm Oct 22, 2009 7:21pm
  •  Mikali
  • | Joined Mar 2008 | Status: Student - School of Hard Pips | 127 Posts
Hi Folks,
I wanted share a trade I placed late last night that never triggered because a few interesting ideas and points were raised over on the James16 chart thread. This may be a long post so I apologize now.

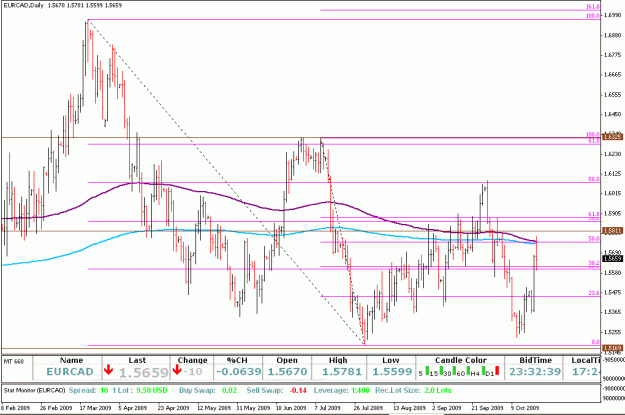
EURCAD Daily PB Set-up

Why I Placed the Trade:
A bearish PB formation appeared on the daily chart that supported the weekly and monthly downward trend. Multiple confluence points were present, I observed confluence of the 50 Fib along with 200 and 365 ema's on the nose as well as 38 and 23 Fib confluence on the tail.

The Trade:
Sell Stop Pending Order @ 1.5600
SL @ 1.5781
TP 1 @ 1.5500
TP 2 @ 1.5371

Trade Result:
The trade was cancelled because the PB never broke.

Analysis:
I spent a number of hours starring at the charts trying to understand why this PB failed.....this was my first mistake. Both James16 (Jim) and mbqb11 (Mike) clearly pointed out it was not a case of PB failure because a PB is NOT
valid until the break of the tail (the low in this case).

AnimalHungry (aka Simon) came up with an interesting point/reason as to why he did not place the trade. Simon decided against the trade because of the large bullish bar that appeared the previous day. Simon felt that the PB was a signal that the market was resting "taking a breather" prior to continuing its upward move. I felt Simon's view of bar size had some merit as it kind of supported Mike's analysis of my failed AUDCHF PB trade from earlier in the week. In that trade, Mike pointed out that in a strong trending market a small size PA will have a hard time reversing the trend. Although, we are talking about size of a bar vs. strength of a trend the underlying theme of bar size is evident and something to consider.

So the trade never triggered now what?
Jim and Mike pointed out that not all was lost on this trade opportunity as there could be a possible trade on the break of the PB after an inside bar. Mike shared his trade strategy in this situation: "Personally I only play IBs after pins if the IB has the shape of a pin look, so it still looks very much as if the pin is in play. In that case I leave my order as is under the pin". Mike's chart example illustrates the set-up better then I could ever explain it: http://www.forexfactory.com/showpost...ostcount=46663

I hope everyone was able to take away a little something from this non-trade. If you have any further comments or ideas you would like to share please post them.

Thanks,
Mikali
Attached Image(s) (click to enlarge)
Click to Enlarge

Name: EURCAD 21-Oct-09.gif
Size: 26 KB
Click to Enlarge

Name: EURCAD 22-Oct-09.gif
Size: 28 KB
 
 
  • Post #15
  • Quote
  • Oct 23, 2009 6:52am Oct 23, 2009 6:52am
  •  Mikali
  • | Joined Mar 2008 | Status: Student - School of Hard Pips | 127 Posts
Hi Folks,
For those of you who may be following this thread, I got a fantastic summary from bundyraider on this trade over on the James16 Chart Thread that I would like to share with you.

Here it is: http://www.forexfactory.com/showpost...ostcount=46681

Thanks bundyraider!!
Mikali
 
 
  • Post #16
  • Quote
  • Last Post: Oct 26, 2009 4:57pm Oct 26, 2009 4:57pm
  •  Mikali
  • | Joined Mar 2008 | Status: Student - School of Hard Pips | 127 Posts
Hi Folks,
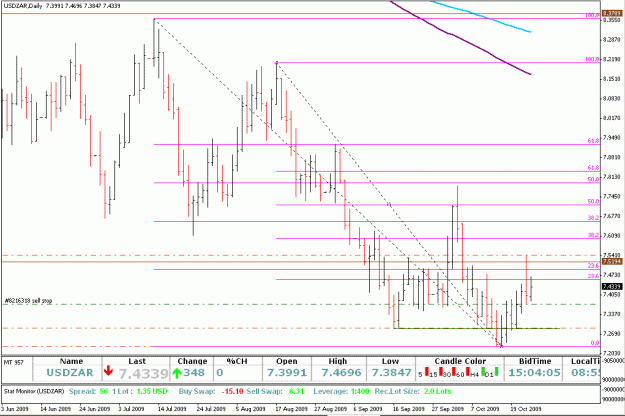
I wanted to update this journal with a pending trade I placed late last Thursday. The pending trade was based on a bearish PB on the USDZAR Daily chart.

Why I Placed the Trade:
The market was trending downwards which supported the bearish PB price action. The PB itself had a small body and a long nose that protruded above the recent price bars giving it. I also noted there was confluence of a PPZ and 23 Fibs's.

The Trade:
I placed a pending sell stop order @ 7.3733
SL @ 7.5429
TP1 @ 7.2916
TP2 @ 7.2276

By the close of the New York session on Friday the PB never triggered (i.e. the PB never broke) and as such, the pending order was also never triggered. I decided not to cancel the order based on a trade idea that was presented to me last week by James16 and mbqb11 over on the James16 Chart Thread. Basically, the idea is to play the break of the PB after the inside bar. Meaning, since the PB never broke the nose of the PB it formed an IB. My sentiment for this pair was bearish and thus, I was looking for the inside bar to break down. By mid day today, the IB broke to upside and I cancelled my order.

Perhaps some senior members could offer some feedback because I did not see any indication as to why the PB and subsequently the IB never broke to the downside. In the end no harm no foul as they say.

Cheers,
Mikali
Attached Image(s) (click to enlarge)
Click to Enlarge

Name: USDZAR 23-Oct-09.gif
Size: 25 KB
Click to Enlarge

Name: USDZAR 26-Oct-09.gif
Size: 24 KB
 
 
  • Trading Journals
  • /
  • Mikali’s Journal – My Trading Journey Using the James16 Methodology
  • Reply to Thread
0 traders viewing now
Top of Page
  • Facebook
  • Twitter
About FF
  • Mission
  • Products
  • User Guide
  • Media Kit
  • Blog
  • Contact
FF Products
  • Forums
  • Trades
  • Calendar
  • News
  • Market
  • Brokers
  • Trade Explorer
FF Website
  • Homepage
  • Search
  • Members
  • Report a Bug
Follow FF
  • Facebook
  • Twitter

FF Sister Sites:

  • Metals Mine
  • Energy EXCH
  • Crypto Craft

Forex Factory® is a brand of Fair Economy, Inc.

Terms of Service / ©2023