|
Membership Revoked
|
Joined Nov 2010
|3,072 Posts
Okay
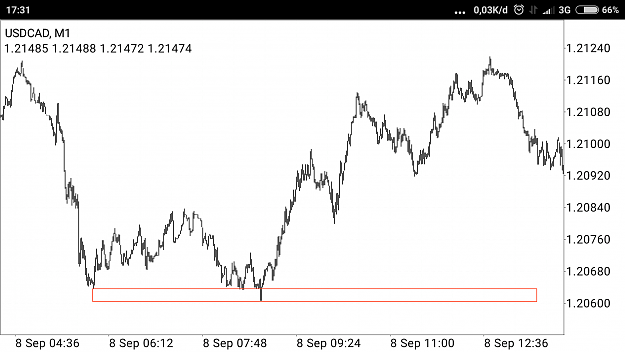
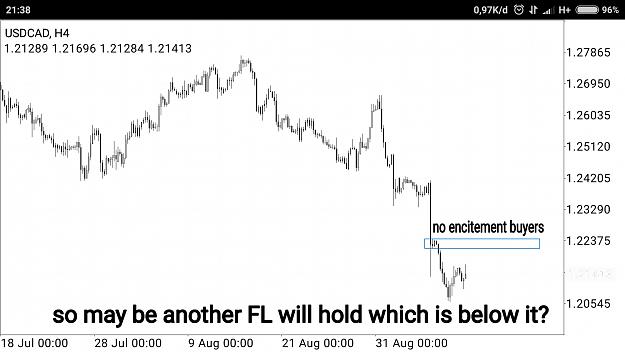
So this is the first push into the zone.
I see that there are a few orders left at the price you marked on the recent low.
What I don't see yet is a powerful enticement for the herd to buy, which is important at a place where the ITs want to turn price.
What I'd like to see is a strong bullish move made from here, to get the buyers in, so their stops can be taken at around 1.2012 or 1.19 40 to 50
Okay So this is the first push into the zone. I see that there are a few orders left at the price you marked on the recent low. What I don't see yet is a powerful enticement for the herd to buy, which is important at a place where the ITs want to turn price. What I'd like to see is a strong bullish move made from here, to get the buyers in, so their stops can be taken at around 1.2012 or 1.19 40 to 50
Ignored
Um....
Try to understand you IF with this images...
There is typos for enticement. That I write it encitement.
Umm... There is my question there.
I rewrite here....
So, do you think its better to spot QM DM and CP first then FL second? Or FL first then PA?
Do I understand what you mentioned before?
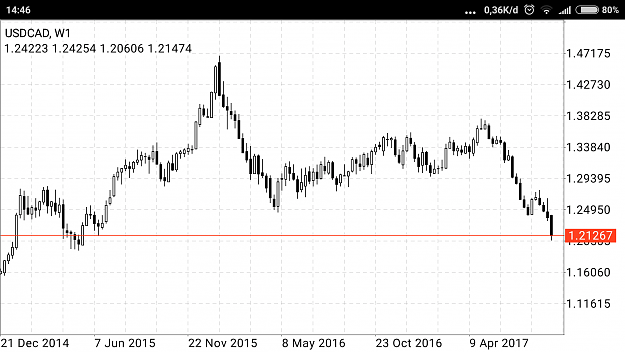
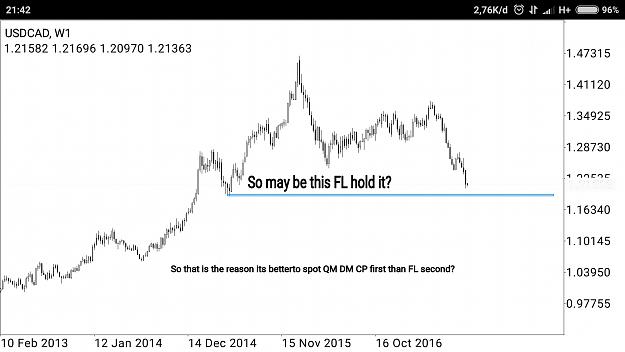
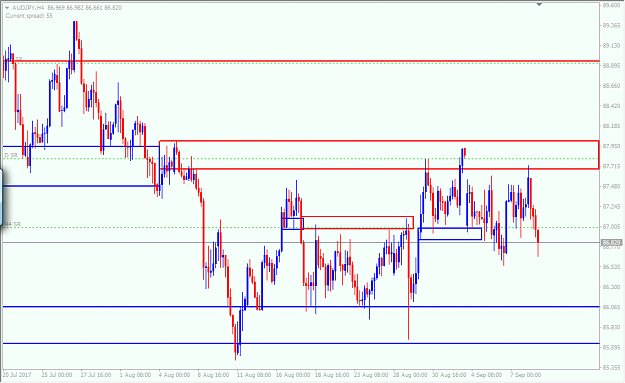
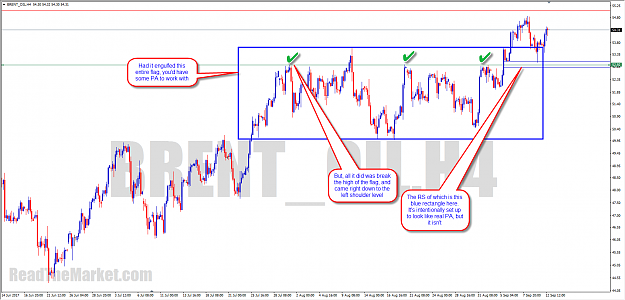
I marked this AUD/JPY Weekly chart early this month and notice that there was a possible engulf down.
Attached Image (click to enlarge)
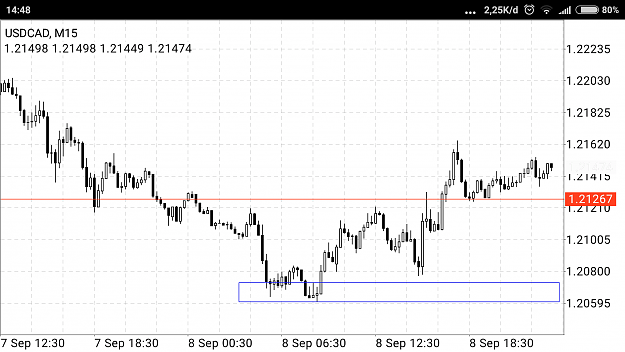
Last Sunday, I remark H4 TF chart. It seem that price wanna go lower.
Attached Image (click to enlarge)
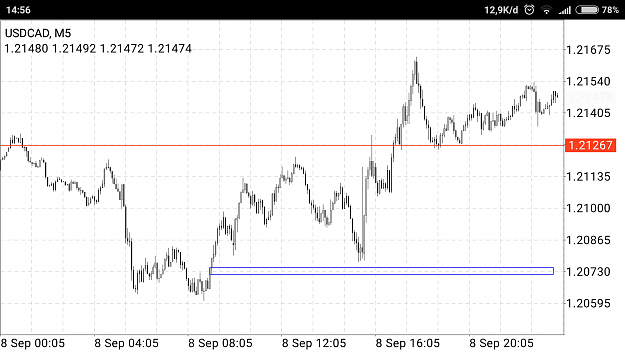
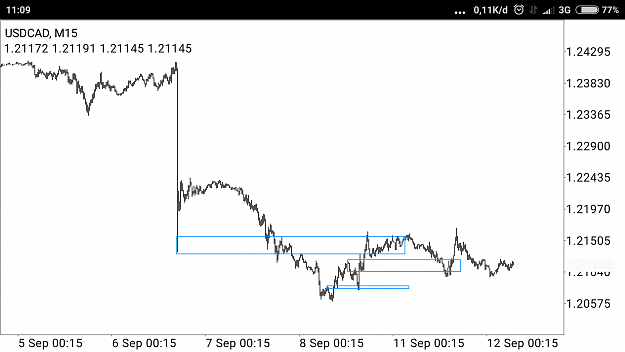
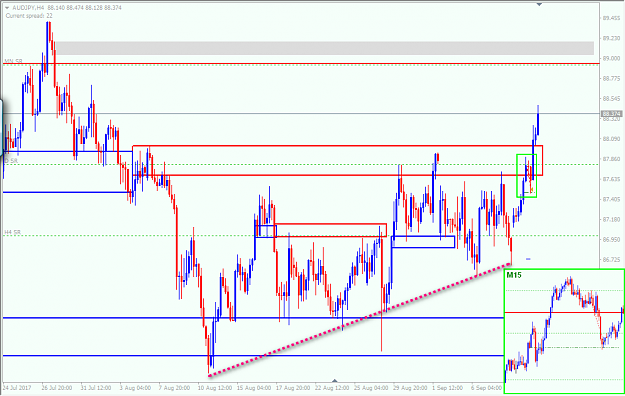
So, when price came back to the upper FL, I happily took it. Then price went down and hit QM level in M15. I knew price would bounce in that level. But how far, I can't tell, so I closed my position.
Attached Image (click to enlarge)
Then as you can see, price shoot up and broke that FL. My scenario failed. As price going up with cp, there is a possibility that it makes a cancan. Or, I simply just make mistake in reading price at HTF.
So far, I find myself still struggling to determine proper FL and -of course- it's engulf. Sometimes (or many times), I think price has engulf, but what price actually did was hit a better level at lower/higher price of my marking FL. And most of the time, that better level hidden in lower TF. Another my recurring problem is, when I notice a good level but price approach it with a single long candlestick, I will lost the nerve to trade that level. Then price just turn as expected. One of IT's trick and I still fall for it.
But I think I'm making a bit progress. I noticed that several RBR/DBDs are simply meant to be broke, price will not respect that area on return (this is where simple S/D failed). Now, I knew one of the reason why that area failed to hold price: no order left. Thanks to IF for answered my question on NU chart last week.
There is still many many things to learn and I will not give up
Guys,
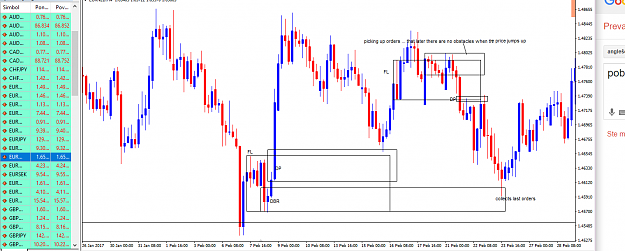
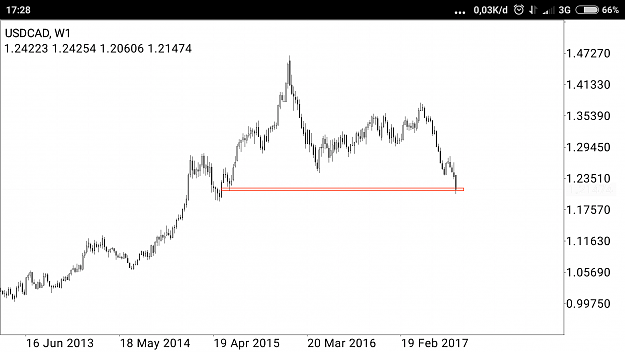
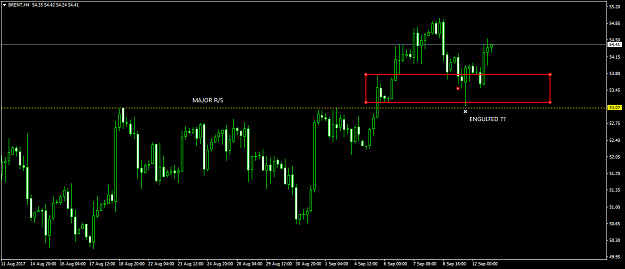
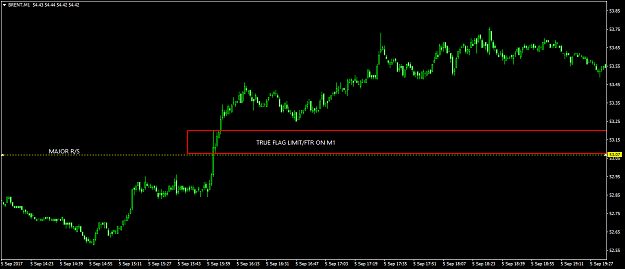
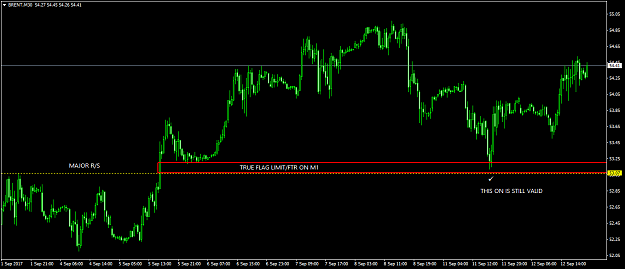
Since no one replied to my previous post I decided to give it one more try. Below you will find recent examples of major R/S breach and creation of two Flag Limits/FTR (it depends which TF we choose). I assume in that case LTF is of more importance since it truly reveals the real FTR after the R/S break - am I right ? Taking that into account we shouldn't look for shorts higher , be it around QM/higher FTRs (which would be the case if that level really broke)
I marked this AUD/JPY Weekly chart early this month and notice that there was a possible engulf down. {image} Last Sunday, I remark H4 TF chart. It seem that price wanna go lower. {image} So, when price came back to the upper FL, I happily took it. Then price went down and hit QM level in M15. I knew price would bounce in that level. But how far, I can't tell, so I closed my position. {image} Then as you can see, price shoot up and broke that FL. My scenario failed. As price going up with cp, there is a possibility that it makes a cancan. Or, I...
Ignored
If you see Weekly PA, you need to trade the Weekly scale. Trading from the nearest H4 level is very dangerous. Give the ITs a chance to get lots of retail sellers in, all the way up, so they can take their stops higher. Don't give them your orders until every other retailer is stopped out
Guys, Since no one replied to my previous post I decided to give it one more try. Below you will find recent examples of major R/S breach and creation of two Flag Limits/FTR (it depends which TF we choose). I assume in that case LTF is of more importance since it truly reveals the real FTR after the R/S break - am I right ? Taking that into account we shouldn't look for shorts higher , be it around QM/higher FTRs (which would be the case if that level really broke){image}{image}{image}
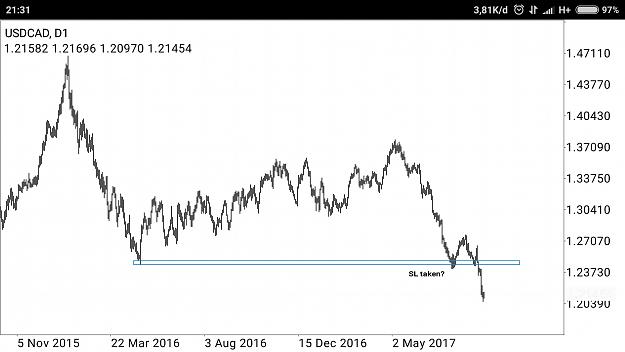
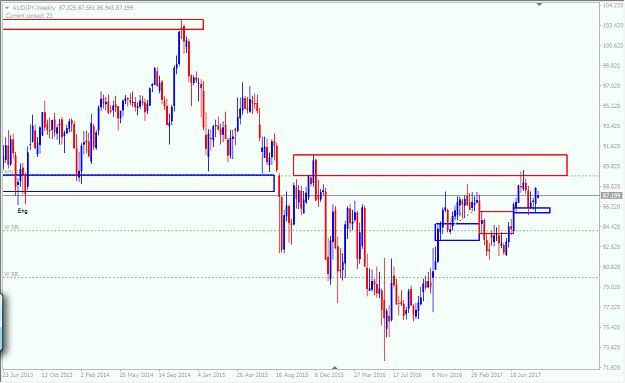
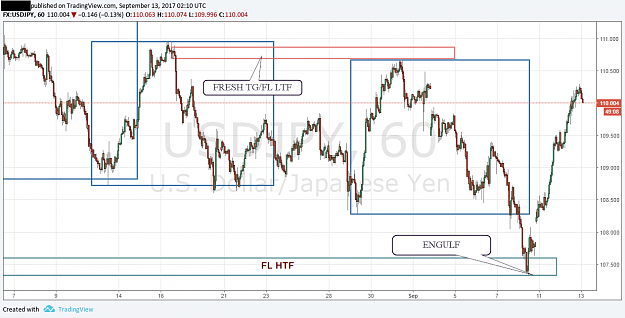
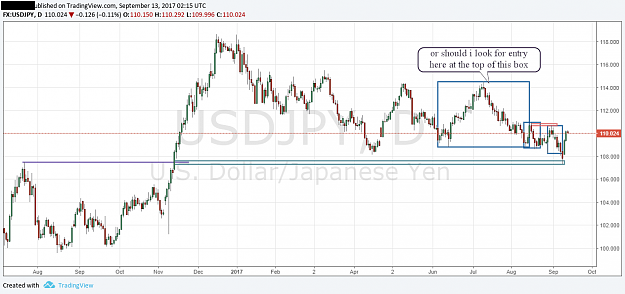
Hi guys, An FL of daily RS has been engulf, The red box which is fresh LTF FL/FTR has not been hit by few pips, hence a better price for IT. Should i look for short entry at the red box or should i look at the top of the blue box of daily chart. Its quite confusing for me to understand how to find the source of an engulf of FL or in this case the source of the down move. Hope that i am on the right track.
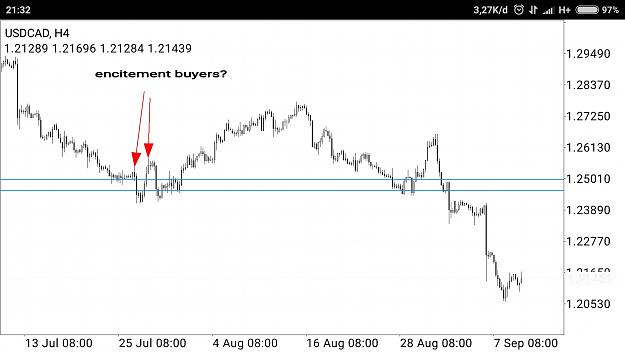
Hi, IF and others Sorry not to spamming... It doesnt mean I dont believe IF. But based on chart and FL engulf. South and North are engulfed. So we can sell it then buy it? Cause the PA is hanging there.... {image}
Ignored
Looks to me like north is engulfed lately and price found support down there. Time to go up and test. Aka previously price meet target already, not retraced and prepare second push
Hi guys, An FL of daily RS has been engulf, The red box which is fresh LTF FL/FTR has not been hit by few pips, hence a better price for IT. Should i look for short entry at the red box or should i look at the top of the blue box of daily chart. Its quite confusing for me to understand how to find the source of an engulf of FL or in this case the source of the down move. Hope that i am on the right track. {image} Daily {image}
Ignored
I hope I can contribute some idea here. The price moved so low, that it seems engulfed. Maybe it could be a fakeout? But whatever it is, the price just filled a Monday gap there. There should be a slight retrace here, if not perhaps a turning point for price to go lower when price gets cheaper. You may sell at the red box, but it would also be a good opportunity to short at the gap too
{quote} I hope I can contribute some idea here. The price moved so low, that it seems engulfed. Maybe it could be a fakeout? But whatever it is, the price just filled a Monday gap there. There should be a slight retrace here, if not perhaps a turning point for price to go lower when price gets cheaper. You may sell at the red box, but it would also be a good opportunity to short at the gap too
Ignored
Thank you dude, really appreciate it. Can you elaborate more on the fakeout?
{quote} Thank you dude, really appreciate it. Can you elaborate more on the fakeout?
Ignored
I don't know much but that pinbar seems like a fo to me. The breakthrough isn't that strong. Anyway, we can only know when price travel back down there again.