{image} You won't find this image anywhere else on the internet, as I created it myself, based on my understanding of a course I just attended, that was run by an institutional trader.
Ignored
Great stuff H. Excellent explanation of the emunerate possible causes for how price action unfolds and why as a predictive tool. The only thing I would add to this is that current price can also be a trigger for future action. For those trading momentum you can cheat the hard interpretation of the 'causes' and avoid the why's and simply act on the 'extreme' now's. There is not an explicit informational advantage in trading momentum apart from understanding human behaviour in times of stress. You do need to have an understanding however of past price action using statistics to be able to distinguish between 'normal' versus 'aberrant' price behaviour. Watch out for the tip of the iceberg as a sign of the tsunami underneath. In other words, simply seeing an iceberg is all that's required to know what's possibly behind it. Don't trade the waves of the seas, trade the rare icebergs before they dissipate back into the sea.....and all of those that you can find.
{image} You won't find this image anywhere else on the internet, as I created it myself, based on my understanding of a course I just attended, that was run by an institutional trader. The technical analyst sees only a small part of the total picture. Price charts show HOW price behaves (the EFFECT -- above the water in the image), while the underlying drivers combine in tug-of-war fashion to determine WHY (the CAUSE -- beneath the water in the image). Because the cause always precedes the effect, TA/PA is lagging. All TA/PA is derived from price...
Ignored
Even with special tools and systems, it doesn't look major bank traders don't have obvious edge against retailers. Please have a look at my old posting here: https://www.forexfactory.com/showthr...45#post8521845
(i think trading is not their main business anyway)
Simplicity is the ultimate sophistication - Leonardo da Vinci
Is Market Profile same as Footprint you described above?
Ignored
As far as I can tell, "footprint" charts differ somewhat from software manufacturer to manufacturer, hence some versions may be more similar to MP (which is more precisely standardized) than others. However, the concept of performing a study of bid and ask volumes at each price level appears to be reasonably consistent across all of them, even if they express/display these relationships in different ways. If you Google something like "footprint chart" and switch to Google's 'Images' tab to see what these charts can look like, you'll see what I mean.
Quote
Disliked
Hope you can give us based on your understanding, further elaboration with matching graphical representation (if its not too much a request).
There's a fairly good explanation of order flow basics here.
Even with special tools and systems, it doesn't look major bank traders don't have obvious edge against retailers........
Ignored
Many thanks for the info. I don't want to get into a discussion on comparing institutional vs retail performance, especially as they amount to two very different games. I'm more interested to see whether I can put the information and techniques that I learned from the course to profitable use.
{quote} As far as I can tell, "footprint" charts differ somewhat from software manufacturer to manufacturer, hence some versions may be more similar to MP (which is more precisely standardized) than others. However, the concept of performing a study of bid and ask volumes at each price level appears to be reasonably consistent across all of them, even if they express/display these relationships in different ways. If you Google something like "footprint chart" and switch to Google's 'Images' tab to see what these charts can look like, you'll see...
Ignored
Thank You very much for your prompt reply...wish you well, and success in FX. May "others" take a cue from you, character wise you treat everyone as equal.Hope you stay here for a long time...
{quote} Great stuff H. Excellent explanation of the emunerate possible causes for how price action unfolds and why as a predictive tool. The only thing I would add to this is that current price can also be a trigger for future action. For those trading momentum you can cheat the hard interpretation of the 'causes' and avoid the why's and simply act on the 'extreme' now's. There is not an explicit informational advantage in trading momentum apart from understanding human behaviour in times of stress. You do need to have an understanding however of...
Ignored
Hello good evening Copernicus, can you show me the way for this "momentum" illustration or example or link please...
{quote} Hello good evening Copernicus, can you show me the way for this "momentum" illustration or example or link please... Thank You in advance.
Ignored
Hi aye.
Mate.....not to brag.....but a good starting point at least is my thread which contains heaps of links to what the pro's do in the smaller world of momentum trading under a diversified portfolio. There is a recent illustrative walk-through provided here of a breakout approach on my thread that is backed up by pretty robust statistics.
Hanover's approach is very robust and follows what the Global Macro boys in the professional space do.....but there are a few other ways to also skin the beast. Obviously it then becomes a preference thing. :-)
{quote} Hi aye. Mate.....not to brag.....but a good starting point at least is my thread which contains heaps of links to what the pro's do in the smaller world of momentum trading under a diversified portfolio. There is a recent illustrative walk-through provided here of a breakout approach on my thread that is backed up by pretty robust statistics. Hanover's approach is very robust and follows what the Global Macro boys in the professional space do.....but there are...
Ignored
Thank You Copernicus, I will try to follow you and Hanover's path even with a limited knowledge so far... Great to have you both here in FF.
{quote} Thank You Copernicus, I will try to follow you and Hanover's path even with a limited knowledge so far... Great to have you both here in FF. Again many thanks, Michael
Ignored
It's a pleasure mate.....but unfortunately the Global Macro approach and the Momentum approach are diametrically opposed in some ways.....which ultimately means you need to position yourself in one camp or the other dependent on your preferences. Unlike TA which can be enhanced by an understanding of FA......the Momentum camps and the Global Macro camps cannot afford to pollute each other's styles.
For example....most momentum chasers avoid any news like the plague as it encourages forward prediction and a momentum chaser's resource are his backtests that dictate where price currently lies and how to follow it. On the other hand a Global Macro viewpoint is always projected towards future opportunities.
There can be common stances taken to certain aspects of trading such as risk management and position sizing.....but Global Macro leans heavily on interpreting macroeconomics and predicting future outcomes based on the principles of understanding underlying drivers (the guts of the iceberg of Hanover's diagram).....whereas momentum followers lean heavily of statistics and in particular an understanding of both auto-correlation and the correlation of return distributions and thus principles of diversification.
Hanover and the Global Macro crew would be able to lend more accurate info into their world of operations.
I respect these guys highly but their skills lie outside mine and it takes intense learning to develop the pre-requisite skills you need to have in this arena to be successful.
{quote} It's a pleasure mate.....but unfortunately the Global Macro approach and the Momentum approach are diametrically opposed in some ways.....which ultimately means you need to position yourself in one camp or the other dependent on your preferences. Unlike TA which can be enhanced by an understanding of FA......the Momentum camps and the Global Macro camps cannot afford to pollute each other's styles. For example....most momentum chasers avoid any news like the plague as it encourages forward prediction and a momentum chaser's resource are...
Ignored
Thanks and well noted, (for me)I could put it like this : momentum for short/present analysis but eventually it will sync with the Fundamentals. But again it will be a long way for me and maybe much more convoluted to thread.
{quote} Thanks and well noted, (for me)I could put it like this : momentum for short/present analysis but eventually it will sync with the Fundamentals. But again it will be a long way for me and maybe much more convoluted to thread.
Ignored
Here is a pretty good explanatory article on momentum trading. The focus these days tends to be more towards absolute momentum as opposed to relative momentum....the latter being preferred by rotational strategies which have been outperformed by the former :-)
I'm slowly developing my own approach to trading. As opposed to a 'system', it involves the use of several different concepts, and is extremely complex (I disagree with the 'keep it simple' principle). I'm not looking to experiment with new TA-based ideas, or collaborate with anybody who is predominantly TA-focused, at this point.
Ignored
In response to a PM I received, I will attempt to explain further what I mean by 'discretionary trend trading'. To anybody who's more interested in system/quant trading, then I highly recommend that you read threads like this one, by my good friend Copper Knickers.
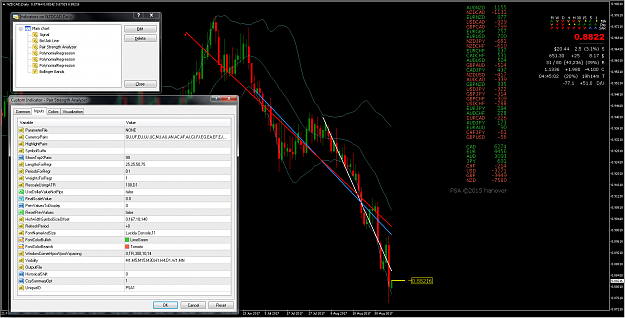
Although I place orders on pairs, my thought processes are focused largely on the strength/weakness (S/W) of individual currencies. Pairing the strongest currencies against the weakest locates what are potentially the strongest trends. Hence I start with the PSA (you can see the settings and resulting values in the screenshot), which gives me an initial idea as to S/W. The white/blue/red lines are 25/50/75 period regression lines (the numbers are not important, it is simply about getting an idea of trend direction and strength).
Attached Image (click to enlarge)
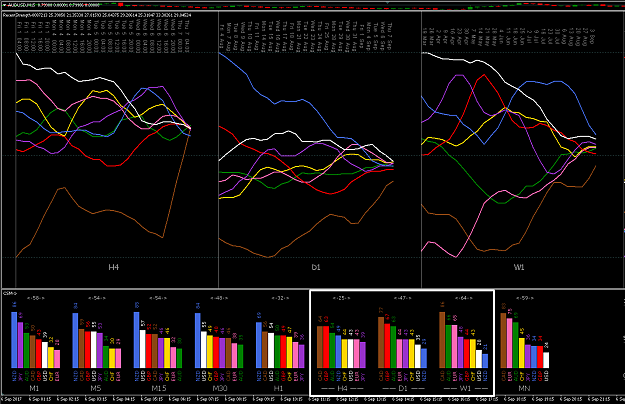
I also check the H4/D1/W1 plots of both RS and CSM to further confirm whether the S/W is weighted more heavily toward the shorter/medium/longer term for each currency. That is the total extent of my TA.
Attached Image (click to enlarge)
For me, discretionary trading is about my 'best guess'; nothing is certain, as the market can do anything it pleases, and news can potentially change prevailing sentiment in a heartbeat. FA-based conviction is EVERYTHING because it is INDEPENDENT OF PRICE. It tells me whether I should stay in a trade -- if the fundamentals are still favorable -- or to exit, if they're not. It is not about a system, it is about building up a 'portfolio' of reasons based on KNOWLEDGE and EXPERIENCE. Here are the main fundamental factors that I use:
Volume and open interest: I want to know (if in a buy trade) whether an increase in volume is due to a fresh influx of enthusiastic buyers, or merely sellers exiting their positions.
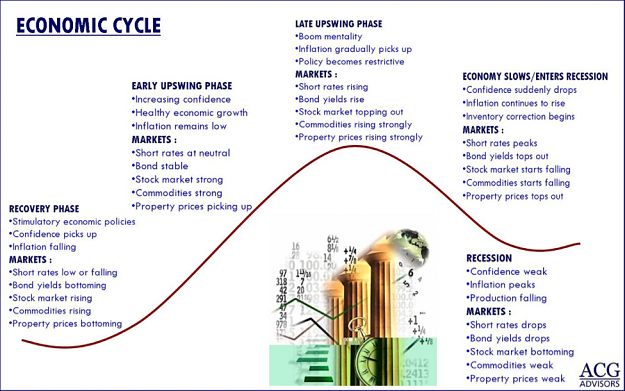
Economic data: which of the two nations' economies is superior, and why? Are critical measures (inflation, production, employment, etc) improving or worsening? What are the relevant central banks focused on? Were recent reserve bank governor speeches (unexpectedly) hawkish or dovish? What geopolitical factors might be exerting influence? To what extent are all of these factors already 'priced in'? Where are we in terms of the economic cycle?
Attached Image (click to enlarge)
Commentary: I subscribe to 2-3 trusted commentators whose opinions I use to help me determine current sentiment, and summarize and interpret recent important news, and economic reports/forecasts from major banks (JP Morgan, Credit Suisse, Citibank, HSBC, BNP Paribas,....).
Intermarket relationships: what are other related markets -- equities, bonds, oil, gold -- doing? Do these point toward risk on or risk off?
Proprietary indicators: I have other (non-price derived) indicators that I look at, to help me gauge where fair value might exist, i.e. whether a currency pair is currently overpriced or underpriced.
Let me stress once again, it is all about CONVICTION. The more price-independent reasons I can find to support a certain direction, the more comfortable I feel about making decisions and taking relevant action, even if price is currently moving against me. In fact, those are often the best opportunities for optimal entries: to buy while price is falling (and amateur money is selling), and vice versa. But only when the prevailing fundamentals support such a move, i.e. they suggest that the adverse move is more likely to be a temporary pullback rather than a total reversal.
Pair selection and direction: comes from the PSA, backed by solid FA-based reasons.
Timing of entry: Nowadays I tend to trade the D1 chart, for two reasons: (1) less time at the computer = more time to pursue my other hobbies, and (2) it aligns better with macro/fundamentals than intraday TFs. I look to enter up to two positions. If I'm buying, the first buy is on the close of a BEARISH D1 candle, and the second is on another BEARISH D1 candle, only after price has fallen at least another X pips, where X is the ADR for the pair. Two entries is the maximum adverse exposure -- RISK MANAGEMENT!!
If the 'trend' is really strong (very steep regression lines), and likewise the FA, then I'll enter (more aggressively) on a 1 candle pullback; in a less strong trend, I wait for either a large candle, or a 2-3 candle pullback. Judgement and experience.
If price is falling into an area of obvious support (prior buying), then that's an additional reason for timing a buy. Likewise a swing failure pattern, exhaustion volume and/or absorption candles.
I'm willing to repeat this process, and add more entries as the trend resumes, and again if the FA measures continue to justify it. The greater the exposure, the greater the FA measures needed to support it.
Obviously the mirror image applies for sell trades.
Stoploss: is at least 2 ADRs, I want to give my positions plenty of elbow room.
Exits: hold the trades, and attempt to build a position as long as the move continues (all 3 regression lines continue to point significantly in the right direction) and (of course!) the FA continues to justify it. Exit when this is no longer the case (and the pair has dropped down the PSA list, causing me to focus on the pairs at the top of the list).
I might look to bank a small part of the position if (in the case of a buy trade) price is extremely overbought, and there is likely to be some profit taking. Then I will look to re-enter that part of the position after a suitable pullback; rinse and repeat.
Position size: I don't work strictly to a percentage of account balance, I size my positions in terms of ADR$, and worst possible scenario in dollar terms, so that I can sleep more easily at night. (I pay my bills in real dollars, not percentages). Also, I look to diversify: spread risk across several pairs, and not leave my account too over-exposed in any one currency.
Targets: I DON'T set targets. This is NOT about making X pips per day; it is about FOCUSING ON THE PROCESS and welcoming whatever the market is kind enough to give me.
Some final thoughts -- Trend trading
The assumption that must be made is that the current 'trend' has the legs to continue, at the point you enter it. Enter too early, and you risk that it is merely a pullback in a trend in the opposite direction; enter too late, and you risk missing it altogether. Because markets consist of conflicting drivers playing tug-of-war, there is no infallible way of knowing how long any move will last. The best you can do is pick the strongest moves -- and either establish to your satisfaction, or simply assume -- that whatever underlying sentiment exists will be strong enough to sustain it further. You try to find multiple independent/uncorrelated reasons that somehow combine to stack the odds in your favor.
Three common ways of timing entry are (1) breakouts in the trend direction, (2) pullbacks to key levels without confirmation (aka "catching a falling knife"), or (3) pullbacks followed by confirmation. All of these have their pros and cons in terms of potential RR and win rate, and I haven't been able to establish that one method is significantly superior to another. I have chosen method (2), but I'm fairly sure that it's possible to get more accurate entries by drilling down to a shorter TF and using key levels, volume, orderflow, candle types etc, if one is willing to spend more time at the computer.
Finally, I recommend this post, which IMHO explains the mindset of a pro trader really well. It is this type of ideology that I'm seeking to aspire to myself. I'm a relative newcomer to this game, and I'm still very much feeling my way, and slowly but surely refining the process.
Guy Baker recently posted a video of a trader outlining a method for testing raw OHLC data in Excel, which I thought looked quite interesting. If I can wrap my head around actually getting Excel to work I'd like to run a similar test based on my own trading method that uses the supdem indie. But first I’ll need to know a little more about how the indie draws a zone.
I've used supdem for quite a few years and on occasion have taken lengthy (non-programmer's) looks at the mq4 file to try and fathom out the logic, but this has been to no avail unfortunately. bredin’s long gone it seems but while searching I noticed your shout on his FF profile. Being that you use the indie I wanted to ask do you have any clues as a programmer how it derives the data to draw a zone? As I say, I’ve taken a long hard look at the code and drew a complete blank.
Being that you use the indie I wanted to ask do you have any clues as a programmer how it derives the data to draw a zone?
Ignored
Simon,
Bredin apparently lives in NZ (as I do) but I've never actually attempted to contact him. It looks like his insanityindustries webpage has been disbanded. This must be a fairly recent event, as I managed to visit it successfully just a few months ago.
It's a long time since I looked at the SupDem code. It's a complex beast and I never figured it out completely.
If we ignore the fib plotting and the alerts, there are three main considerations to the zone/box plotting:
1. Determining the swing high/low points (which are the distal edges of the boxed zones). I believe he has copied the logic from the Zigzag indicator to obtain these. Sorry, that's not much help as I'm not 100% sure how Zigzag works**. But it takes 3 parameters: 'depth', 'deviation', and 'backstep'. By default, SupDem sets these to 3,2,2 respectively (although it makes provision to use combos of 8,5,3 and 13,8,5 and 34,13,8 -- it never actually uses them. Later I modified the indicator to make depth, deviation and backstep user-defined parameters, for my own use -- attached).
So as far as I can tell, and in plain English, that means that -- if candle X is the candle that created the swing low (distal edge) -- it sets p2 equal to the lowest price value of all of these:
i) the highest point of the body of candle X (i.e. its open or close, whichever is higher);
ii) the high of both of the candles to the immediate right or left of candle X;
iii) the highest point of the body of the candle immediately to the left of candle X (i.e. its open or close, whichever is higher);
iv) the highest point of the body of the candle immediately to the right of candle X (i.e. its open or close, whichever is higher).
The mirror image is true for obtaining the proximal edge of supply zones.
3. Next he determines whether a zone is 'strong', 'weak', or a 'retouch'. The indicator allows each of these to be plotted using different colors. I never bothered to try to figure this out, as it wasn't important to me.
All of the above applies to the attached 'II_SupDem v2'. I recall seeing a version 2.33, but I've never used it (or looked at its code).
Without spending a significant amount of time revisiting the code in its entirety, that's the best that I can do.
David
__________________________
[EDIT]
** How Zigzag works -- I found the following here. Don't know if it is correct, let alone helpful:
"ZigZag Indicator tracks and connects extreme points of the chart, the distance between these points being equal or higher than the percentage specified for the price scale.
Depth is the minimal amount of bars where there will not be the second maximum (minimum) Deviation pips higher or lower than the previous one. I.e., ZigZag can always diverge, but it can converge (or completely draw together) more than at the Deviation value only after Depth bars. Backstep is the minimal amount of bars between maximums/minimums.
After the ZigZag has captured the lowest point, it starts to search for the turn point until the rollback down from the maximum value exceeds the parameter. As soon as rollover down exceeds the parameter, the second (in this case, the upper) point is considered for captured, and ZigZag starts to search for the third one (in this case, for the lower one), etc."
{quote} Simon, Bredin apparently lives in NZ (as I do) but I've never actually attempted to contact him. It looks like his insanityindustries webpage has been disbanded. This must be a fairly recent event, as I managed to visit it successfully just a few months ago. It's a long time since I looked at the SupDem code. It's a complex beast and I never figured it out completely. If we ignore the fib plotting and the alerts, there are three main considerations to the zone/box plotting: 1. Determining the swing high/low points (which are the distal edges...
Ignored
Hey David,
Thanks so much for taking the time out to answer this. I'd also drawn a blank with bredin's website; his Youtube channels don't seem to have much activity going on there either. Anyhow, no problem because your answer's confirmed my suspicion that he based a substantive portion of SD on the Zig-Zag indicator.
I've tried on numerous occasions in the past to match Zig-Zag to supdem in a chart but always failed, however, if bredin has incorporated settings for Zig-Zag inside supdem then the reason for that is now clear (as all puzzles are when someone else solves them!) Applying the 3,2,2 default now gives the following perfect match:
Attached Image (click to enlarge)
If I'm to run some kind of automated test in Excel based upon my own strategy then it seems decoding Zig-Zag will be a requirement. At this point I don't have the appetite but better to find that out sooner rather than later. Once again, cheers for your help.
Hello, are you by any chance aware of the history of "oscillator indicators" used in trading ?
Was it just an evolution from the tradition fixed hlc bar ?
(The purpose of which was to gauge where the current price is in relation to the period's high&low range ??)
Which allowed the hlc to become dynamic rather than simply time fixed ? For example the normal d1 hlc just uses periods which segment the price from 00:00 to 24:00. While a dynamic hlc would segment the periods by an hour :from yesterdays 22:00 to todays 22:00,than from yesterdays 23:00 to todays 23:00 and etc...
Do you the name of the first (i assume) oscillator which simply did just that? Without taking momentum into consideration and etc.
are you by any chance aware of the history of "oscillator indicators" used in trading ?......
Ignored
According to wikipedia:
Stochastic oscillator was invented in the 1950s by George Lane, to predict price turning points by comparing the closing price of a security to its price range;
RSI by Welles Wilder in the 1970s, to chart the current and historical strength or weakness of a stock or market based on the closing prices of a recent trading period;
MACD by Gerald Appel in the late 1970s, to reveal changes in the strength, direction, momentum, and duration of a trend in a stock's price;
CCI in 1980 by Donald Lambert, to highlight cyclical trends in commodities;
Williams %R by Larry Williams, to tell whether a stock or commodity market is trading near the high or the low, or somewhere in between, of its recent trading range.
More on the calculations involved here (the same general principles apply to all oscillators). I can't know about the exact reasoning used by each inventor, in determining his calculation. You would need to ask the inventor himself.
However, knowing the formula for each, it is possible to make a reasonable guess, in terms of what it is attempting to measure. For example, with the Stochastic oscillator, it is measuring the location of the latest close relative to the most recent N highs and lows.