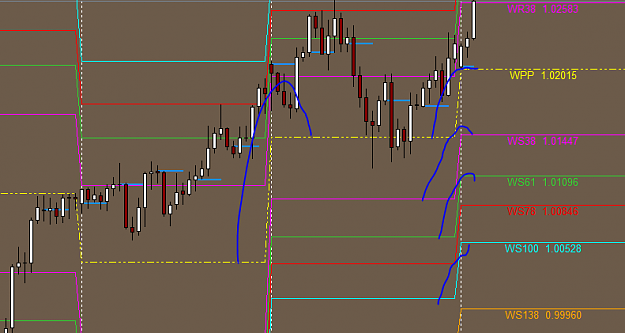
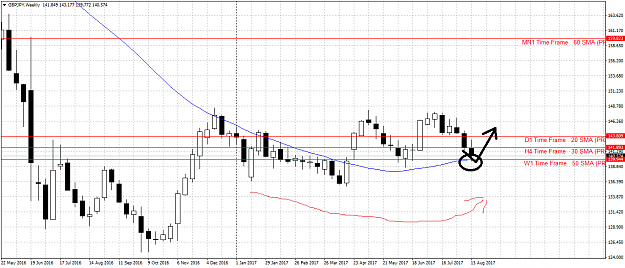
• Home
  • Forums
  • Trades
  • News
  • Calendar
  • Market
  • Brokers
  • Login
  • Join
  • User/Email: Password:
  • 7:15pm
Menu
  • Forums
  • Trades
  • News
  • Calendar
  • Market
  • Brokers
  • Login
  • Join
  • 7:15pm
Sister Sites
  • Metals Mine
  • Energy EXCH
  • Crypto Craft

Options

Bookmark Thread

First Page First Unread Last Page Last Post

Print Thread

Similar Threads

AMAZING Strategy!!! 3,240 replies

WRB/MC strategy:Coder needed to semi-automate my strategy 11 replies

strategy builder/tester for new scalping strategy 1 reply

Is opposite of losing strategy a winning strategy? 21 replies

Daily strategy report 1 reply

  • Trading Systems
  • /
  • Reply to Thread
  • Subscribe
  • 39
Attachments: MidPrice Strategy
Exit Attachments
Tags: MidPrice Strategy
Cancel

MidPrice Strategy

  • Last Post
  •  
  • 1 23Page 4 5
  • 1 23Page 4 5
  •  
  • Post #61
  • Quote
  • Apr 23, 2017 5:33pm Apr 23, 2017 5:33pm
  •  Feliks
  • | Joined Mar 2009 | Status: Member | 194 Posts
Quoting Kwt4x
Disliked
{quote} trading is easy if you don't complicate it. your first demand is: 1) This strategy must be as simple as possible the only rule in the image below is: trade in the direction of the 100SMA slope. entries and exits using the simple stochastics will not confuse you because you are trading in the slope direction. the bands are pure price action to identify HH and HL or vice versa. hope it help {image} {image}
Ignored
I really appreciate your help man. But I can't "wear your shoes" as you can't "mine". So when I see so much "information" on this screen it confuses me, it makes me feel upset. How can I say, it doesn't fit me "no longer". Maybe you are right, maybe you make huge profits by this, believe me I'm glad for you. The only thing i believe in this market now is middle price and its behaiver. Because this method keep my nervous OK.
Think like an investor, Act as a speculator. Ferid H.
 
 
  • Post #62
  • Quote
  • Edited 8:44pm Apr 23, 2017 6:19pm | Edited 8:44pm
  •  ChipsAvocado
  • | Joined Aug 2016 | Status: Member | 10 Posts
Thank you for your system, Feliks.
The rule is: when H4-line is above D-line, go for buy in M15.
Is this rule also applied for other lines, weekly and monthly lines.
If lower line is above higher line, then it's a signal to buy?

How to set SL and TP?

Thank you
 
 
  • Post #63
  • Quote
  • Apr 23, 2017 6:57pm Apr 23, 2017 6:57pm
  •  demondlouis
  • | Joined Apr 2017 | Status: Junior Member | 2 Posts
Nice idea here. Going to add it to my library of indicators.
 
 
  • Post #64
  • Quote
  • Apr 24, 2017 2:38am Apr 24, 2017 2:38am
  •  lordgbengs
  • Joined Jan 2008 | Status: Member | 632 Posts
Quoting grandaevus
Disliked
{quote} Thank you for the feedback. Here's the fixed version. Moving Average to Horizontal Line Indicator V04 {image} {file}
Ignored
Indicator working fine, I see alot of promise from this strategy. Thanks Feliks
D labour of a fool wearieth him cos he doesn't know how to enta d city
 
 
  • Post #65
  • Quote
  • Edited 3:26am Apr 24, 2017 3:13am | Edited 3:26am
  •  Feliks
  • | Joined Mar 2009 | Status: Member | 194 Posts
Quoting ChipsAvocado
Disliked
Thank you for your system, Feliks. The rule is: when H4-line is above D-line, go for buy in M15. Is this rule also applied for other lines, weekly and monthly lines. If lower line is above higher line, then it's a signal to buy? How to set SL and TP? Thank you
Ignored
Thats the question which im working on it. You see the on that case (when H4 higher than Daily), sometimes market moves faster than expected (not touching SMA), therefore you lose your opportunity. Better try to enter after reversals on H4.
Bigger time frames need big account, therefore big SL's. You should ask your "psycho" "Are you ready to watch big drawdowns?" If you ask me, i cant bear that.

Risk management is different. Ill talk about later. Lets say, i create the grid. But talking about risks you should better find my post here about "NEVER".

Have a good trading!
Think like an investor, Act as a speculator. Ferid H.
 
 
  • Post #66
  • Quote
  • Apr 24, 2017 3:19am Apr 24, 2017 3:19am
  •  Feliks
  • | Joined Mar 2009 | Status: Member | 194 Posts
Quoting lordgbengs
Disliked
{quote} Indicator working fine, I see alot of promise from this strategy. Thanks Feliks
Ignored
Yeah, thx for grandaveus. I wish i could add it in MT4 for mobile. Still move manually.

Try to stick to the price behavior, its pattern more than tools

It takes years for eyes to "save patterns". The market is something like whole bunch of "de javus" for me.
Think like an investor, Act as a speculator. Ferid H.
 
 
  • Post #67
  • Quote
  • May 1, 2017 4:54am May 1, 2017 4:54am
  •  lordgbengs
  • Joined Jan 2008 | Status: Member | 632 Posts
Quoting grandaevus
Disliked
{quote} Thank you for the feedback. Here's the fixed version. Moving Average to Horizontal Line Indicator V04 {image} {file}
Ignored
Hi Grandaevus, just thinking if you could a some lines that show the historical movement of the lines based on your current or desired timeframe, something like the below;

Attached Image (click to enlarge)
Click to Enlarge

Name: Screenshot3.png
Size: 31 KB


Many thanks
D labour of a fool wearieth him cos he doesn't know how to enta d city
 
 
  • Post #68
  • Quote
  • Edited 8:48pm Aug 14, 2017 8:37pm | Edited 8:48pm
  •  aboantr1
  • | Joined Nov 2015 | Status: Member | 19 Posts
[كوت = فيليكس؛ 9786685] {كوت} يس [/ كوت]

Thanks for your ... great work . I think 1,1018 (1,0692 + 1,0707 + 1,068 + 1,0906 + 1,2109 = 5,5094 / 5)
Output = montalipipot

Thanks Feliks xoxoxooxoxoxox
Thanks grandaevus xoxoxooxoxoxox
Attached File(s)
File Type: mq4 AutoPivotIndicator_ver6.mq4   63 KB | 147 downloads
 
1
  • Post #69
  • Quote
  • Aug 14, 2017 8:42pm Aug 14, 2017 8:42pm
  •  aboantr1
  • | Joined Nov 2015 | Status: Member | 19 Posts
These are some similar and effective indicators
Attached File(s)
File Type: mq4 murrey_math_alltf2.mq4   29 KB | 135 downloads
Attached File(s)
File Type: mq4 Murrey_Math_MT4_VG2.mq4   21 KB | 132 downloads
Attached File(s)
File Type: mq4 FXTT_MTF_BollingerBands2.mq4   25 KB | 150 downloads

Thanks Feliks
Thanks grandaevus
 
1
  • Post #70
  • Quote
  • Aug 19, 2017 2:59am Aug 19, 2017 2:59am
  •  Feliks
  • | Joined Mar 2009 | Status: Member | 194 Posts
The point is how far i am trying to reduce using indicators, as much it's coming back again. All in all, I have been trading with this strategy from february and see it has really good potential.

The problem is (as always existed) human. It really difficult to do the same for long duration for human.

Little bit what i have researched from this strategy:

1) Moving averages give you areas where price can be retraced. Signal is getting weak from Monthly till H4.
as example GBPJPW

2) The best signals come on "Fisrt Touch"

3) Reversal Candlestick patterns WITH confirmation higher Time Frames.
First you look previous monthly. Then you have to visualize what can be happen, therefore what you will be ready for. This part takes experience.
You have to get familiar with the candlestick patterns behaviour. I mean it feels like sometime "you know whats can happen, but you can not explain reason".
It may sound ridiculous, the instinct does exist here.

3) The best reversal pattern for me:

Monthly
Previous candle is bullish
Current candle's high is higher than previous high
Current candles's close lower than its open
Current candles's close is in previous body or lower that previous close

Then you wait similiar one in Weekly, then Daily

From combination H4 and M15 you try to find best price for sell

Opposite for long

Maybe someone can code reversal patterns (not all and not in every movement)

The signals appear in movements, not in top (for buy signal) is very false (like green USDJPY).

USDJPY as example
Attached Image(s) (click to enlarge)
Click to Enlarge

Name: GBPJPYWeekly.png
Size: 54 KB
Click to Enlarge

Name: USDJPYMonthly.png
Size: 44 KB
Think like an investor, Act as a speculator. Ferid H.
 
 
  • Post #71
  • Quote
  • Aug 19, 2017 9:54pm Aug 19, 2017 9:54pm
  •  aboantr1
  • | Joined Nov 2015 | Status: Member | 19 Posts
Please find or create an Excel spreadsheet for all moving averages ranging from 1000 to 5
 
 
  • Post #72
  • Quote
  • Aug 19, 2017 10:52pm Aug 19, 2017 10:52pm
  •  aboantr1
  • | Joined Nov 2015 | Status: Member | 19 Posts
This may be helpful
http://www.tradinggeeks.net/2014/05/...-excel-part-i/

This is a picture of a worksheet .. The strength of the currency
Attached Image (click to enlarge)
Click to Enlarge

Name: 2017-08-20_044832.png
Size: 201 KB
 
 
  • Post #73
  • Quote
  • Aug 19, 2017 11:21pm Aug 19, 2017 11:21pm
  •  aboantr1
  • | Joined Nov 2015 | Status: Member | 19 Posts
Can anyone bring the Excel here in this picture ??
Attached Image (click to enlarge)
Click to Enlarge

Name: 2017-08-20_050506.png
Size: 2.1 MB
 
 
  • Post #74
  • Quote
  • Aug 20, 2017 11:16pm Aug 20, 2017 11:16pm
  •  aboantr1
  • | Joined Nov 2015 | Status: Member | 19 Posts

DJ USD/JPY Keeps Eyeing 108.00 Short-Term Charting Forex

The following is a technical analysis of seven major currency pairs for this week:

USD/JPY
1st support - 108.00 (major)
1st resistance - 114.35 (major)
2nd support - 105.50 (moderate)
2nd resistance - 115.50 (major)


USD/JPY (last 109.29): The pair is trading below its declining 20-day moving average, which plays a resistance role. The relative strength index is bearish and calls for a further drop. To sum up, as long as 114.35 holds on the upside, look for a new decline to 108.00 and even to 105.50 in extension. Only a break above 114.35 would turn the outlook to positive and calls for a rebound with 115.50 and 118.50 as targets.

EUR/USD
1st support - 1.1300 (major)
1st resistance - 1.2040 (moderate)
2nd support - 1.1120 (minor)
2nd resistance - 1.2200 (moderate)


EUR/USD (last 1.1752): The technical picture of the pair is positive as the prices are supported by the bullish trend line since April. The upward momentum is further reinforced by the rising 50-day moving average. The relative strength index is above its neutrality level at 50. Hence, as long as 1.1300 is not broken, look for a further upside to 1.2040 and even to 1.2200 in extension. Alternatively, below 1.1300, expect a return with 1.1120 as a down target.

AUD/USD
1st support - 0.7710 (major)
1st resistance - 0.8085 (major)
2nd support - 0.7565 (moderate)
2nd resistance - 0.8250 (moderate)


AUD/USD (last 0.7921): Although the pair posted a pullback and broke below its 20-day moving average, it is still trading above the rising 50-day moving average. The relative strength index is above its neutrality level at 50. To sum up, as long as 0.7710 is not broken, look for a further upside to 0.8085 and even to 0.8250 in extension. Alternatively, a break below 0.7710 would turn the outlook to positive with up targets at 0.7565 and 0.7465.

NZD/USD
1st support - 0.7195 (major)
1st resistance - 0.7620 (major)
2nd support - 0.7080 (major)
2nd resistance - 0.7750 (major)


NZD/USD (last 0.7318): Despite the pair retreating, a support base at 0.7195 has formed and has allowed for a temporary stabilization. Even though a continuation of consolidation cannot be ruled out, its extent should be limited. To conclude, as long as 0.7195 holds on the downside, a further upside to 0.7620 and even to 0.7750 seems more likely to occur. Alternatively, only a break below 0.7195 would turn the outlook to negative with down targets at 0.7080 and 0.6950.

GBP/USD
1st support - 1.2600 (major)
1st resistance - 1.3440 (major)
2nd support - 1.2350 (moderate)
2nd resistance - 1.4000 (moderate)


GBP/USD (last 1.2866): The pair broke below its 20-day and 50-day moving averages and is consolidating. The relative strength index is below its neutrality level at 50 and lacks upward momentum. Nevertheless, 1.2600 is playing a key support role, which should limit the downside potential. Even though a continuation of consolidation cannot be ruled out, its extent should be limited. As long as 1.2600 is not broken, look for a further advance towards 1.3440 and even 1.4000 in extension. Only a break below 1.2600 would turn the outlook to negative with a down target at 1.2350.

USD/CHF
1st support - 0.9440 (major)
1st resistance - 0.9850 (major)
2nd support - 0.9275 (major)
2nd resistance - 1.0100 (major)


USD/CHF (last 0.9653): The pair is consolidating below its key resistance at 0.9850, which should limit the upside potential, and is trading around its 20-day and 50-day moving averages. The relative strength index is around its neutrality level at 50 and lacks upward momentum. Even though a continuation of technical rebound cannot be ruled out, its extent should be limited. As long as 0.9850 holds on the upside, the pair is likely to test its next support at 0.9440 again. A break below this level would call for a further decline toward 0.9275. Only a break above 0.9850 would turn the outlook to positive with an up target at 1.0100.

USD/CAD
1st support - 1.2400 (moderate)
1st resistance - 1.3020 (major)
2nd support - 1.2200 (major)
2nd resistance - 1.3200 (minor)


USD/CAD (last 1.2592): The pair broke below the lower boundary of a bullish channel and is consolidating on the downside. The declining 50-day moving average is playing a resistance role and maintains the downside bias. The relative strength index is below its neutrality level at 50 and lacks upward momentum. As long as the key level at 1.3020 holds on the upside, look for a further decline towards 1.2400 and even 1.2200 in extension. A break above 1.3020 would turn the outlook to positive with an up target at 1.3200.


  • Post #75
  • Quote
  • Aug 20, 2017 11:22pm Aug 20, 2017 11:22pm
  •  aboantr1
  • | Joined Nov 2015 | Status: Member | 19 Posts

oday is 21/8/2017
a technical analysis of seven major currency pairs for this week


  • Post #76
  • Quote
  • Aug 21, 2017 3:19am Aug 21, 2017 3:19am
  •  aboantr1
  • | Joined Nov 2015 | Status: Member | 19 Posts
EUR / NZD
21 August 2017, 07:06

Scenario
Time Frame
SELL STOP Recommendations
Point of entry
Profit Gain
Stop Loss
For main levels
Alternative Scenario
BUY STOP RECOMMENDATIONS
Point of entry
Profit Gain
Stop Loss
For main levels
...................................................................................
GBP / JPY
August 21, 2017, 07:11

Scenario
Time Frame
SELL Recommendations
Point of entry
Profit Gain 139.610
Stop Loss
Main levels
 
 
  • Post #77
  • Quote
  • Aug 24, 2017 11:50pm Aug 24, 2017 11:50pm
  •  aboantr1
  • | Joined Nov 2015 | Status: Member | 19 Posts
Feliks I want to know what you are saying about this indicator
I think this is what you are looking for
Attached File(s)
File Type: mq4 sixths by aboantr1.mq4   8 KB | 145 downloads
 
 
  • Post #78
  • Quote
  • Aug 27, 2017 4:21pm Aug 27, 2017 4:21pm
  •  kingcrab
  • | Joined May 2006 | Status: Member | 27 Posts
hi Feliks.....envelopes make it interesting
 
 
  • Post #79
  • Quote
  • Sep 1, 2017 3:18pm Sep 1, 2017 3:18pm
  •  Feliks
  • | Joined Mar 2009 | Status: Member | 194 Posts
Guys, try to find out how to trade without indi. Now i have researched M15 is making quite a lot false. So Im going to use only this TF's
MN - 60SMA
Weekly 50 SMA
Daily 20 SMA
H4 30 SMA

For me now the best setup comes up when price does its first touch on Weekly, consequently you wait reversal pattern on Daily, then H4. It almost true always.
Think like an investor, Act as a speculator. Ferid H.
 
1
  • Post #80
  • Quote
  • Sep 3, 2017 2:44am Sep 3, 2017 2:44am
  •  aboantr1
  • | Joined Nov 2015 | Status: Member | 19 Posts
Can you explain your strategy in video True returns when price touches weekly,,, and sometimes other line breaks through the week and completes the way! !!!!! How to handle t True price returns when price touches weekly,,, and sometimes other line breaks through the week and completes the way! !!!!! How to handle this? ?
 
 
  • Trading Systems
  • /
  • MidPrice Strategy
  • Reply to Thread
    • 1 23Page 4 5
    • 1 23Page 4 5
0 traders viewing now
  • More
Top of Page
  • Facebook
  • Twitter
About FF
  • Mission
  • Products
  • User Guide
  • Media Kit
  • Blog
  • Contact
FF Products
  • Forums
  • Trades
  • Calendar
  • News
  • Market
  • Brokers
  • Trade Explorer
FF Website
  • Homepage
  • Search
  • Members
  • Report a Bug
Follow FF
  • Facebook
  • Twitter

FF Sister Sites:

  • Metals Mine
  • Energy EXCH
  • Crypto Craft

Forex Factory® is a brand of Fair Economy, Inc.

Terms of Service / ©2023