For those of you that have been watching my performance.... I did double my lot size but DO NOT plan on increasing it anymore. I did hit 10% DD yesterday during the Trump email fiasco. The USD made up some lost ground today after Trumps email rebuttal and Yellen's speech. The pullback gave me over 1% profit today. I went from 10% DD less than 10 hours ago to 1% profit today. I was ready for a pullback but was not expecting it to happen overnight. Sometimes these things can happen. Things went abruptly against me just to go abruptly back in my favor....
Ignored
Hello Ryan
How do you set your Take profit.I am getting difficulty with it.
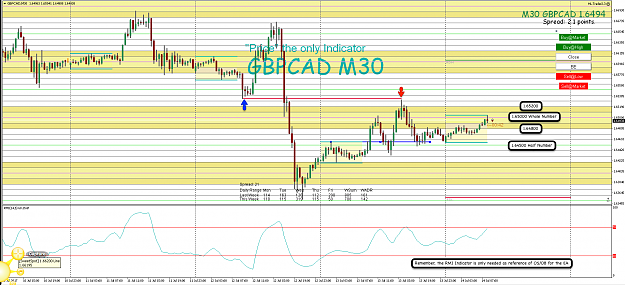
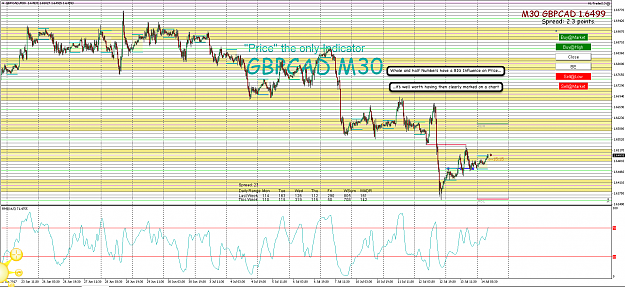
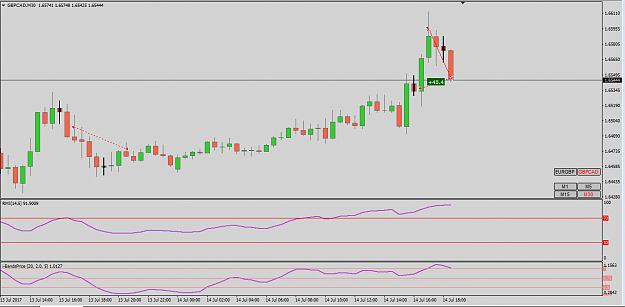
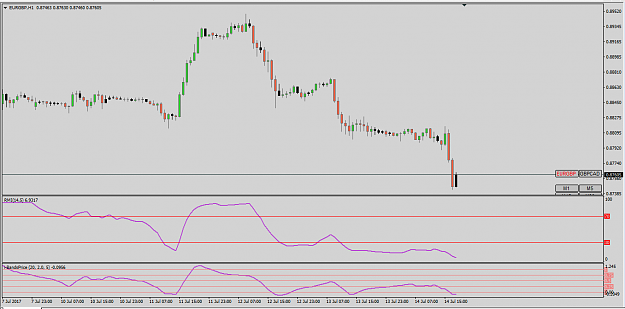
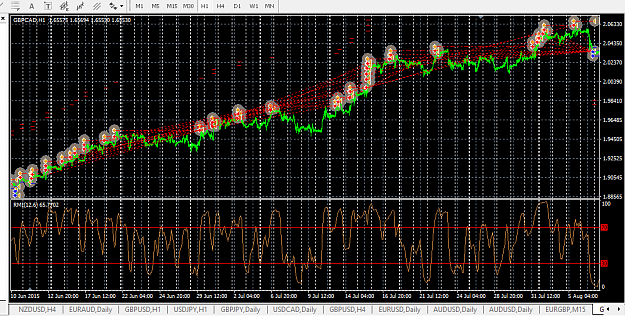
{quote} Hi Osfx, Don't forget the RMI Indicator is used with the EA to identify OB/OS situations. It's more important, when Trading manually, to observe how Price reacts from previous Swing Points and Whole / Half Numbers. {image} {image}
Ignored
You're right, but saad007 especially marked the RMI in his request.
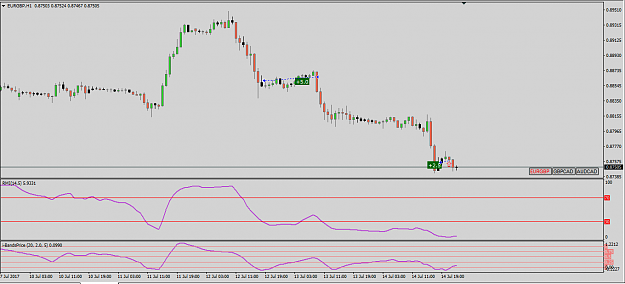
{quote} Hello Ryan How do you set your Take profit.I am getting difficulty with it. {image}
Ignored
You must explore this on your own as many TP options work. You can use a $ amount, a pip amount or a %. I've found that typically a TP over 60 pips is too much.
Just got this from from my friend Robert today... "This is one of the most solid and safe strategies i have ever worked with." This is the friend I'm trading $120k for. Feels pretty good to get that feedback
{quote} You must explore this on your own as many TP options work. You can use a $ amount, a pip amount or a %. I've found that typically a TP over 60 pips is too much.
Ignored
What do you prefer?As you used you know what's best for this.
Do you see SR to take profit.I am willing to use 2/3 ATR.How will be it.
Joined May 2013
|
Status: PLAN YOUR TRADE and TRADE YOUR PLAN
|509 Posts
Hello Cubbybgood I have seen your myfxbook LMFX Personal Account closed.Do you changing your broker or else?
Also Robert Managed Account (active) trades are private.
Greetings all,
I have stumbled upon this journal and was inspired by Cubbybgood's EA results and screen cast's. Congratulations Cubbybgood .. I have attempted various price action setups with grid entries before and could not get them to work over long time periods.
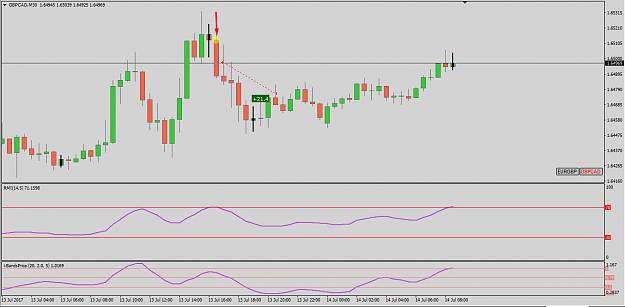
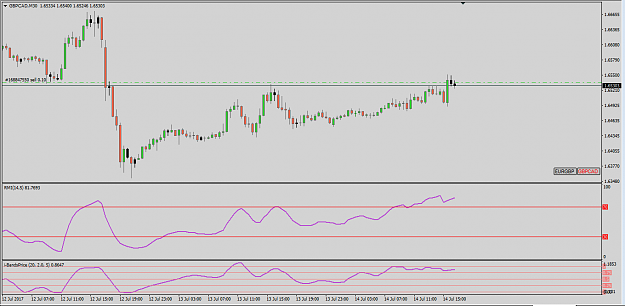
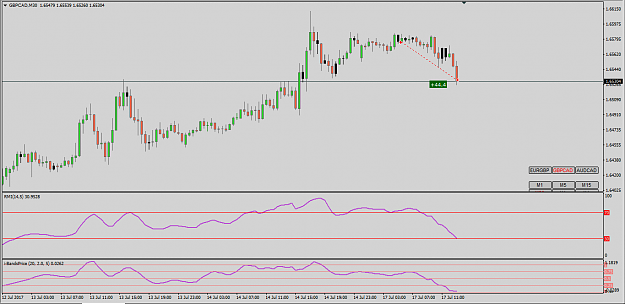
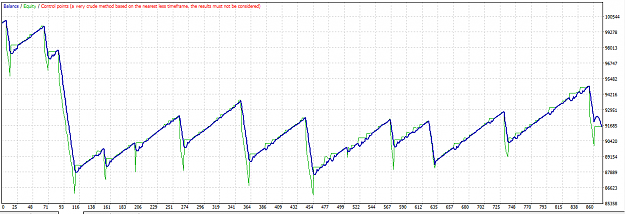
Unfortunately I am not able to make this system work, and it seems to break down in the same way the other grid systems I have tried. I believe I have followed all the rules of the system as per the screen cast and have found I don't get anywhere near the results shown by Cubbybgood. I have found that the system as per my interpretation works for a short period then suffers catastrophic loss from extended trending price. (Example attached)
Attached Image (click to enlarge)
Attached Image (click to enlarge)
My rules are:
Enter Short on bar open if:
previous bar was an inside bar
the bar before that was a bullish bar
and the current Bid is above the RMI
50 pip TP & 500 pip SL
continue to add sell positions at 20 pip intervals as price moves against entry
Take profit at average entry price -50pips
GBPCAD M30
0.1 lots per $10,000
Using control points for testing
Am I missing anything from the system?
Please note I am not questioning Cubbybgood's results or system in anyway I am just trying to understand what I am missing.
Greetings all, I have stumbled upon this journal and was inspired by Cubbybgood's EA results and screen cast's. Congratulations Cubbybgood .. I have attempted various price action setups with grid entries before and could not get them to work over long time periods. Unfortunately I am not able to make this system work, and it seems to break down in the same way the other grid systems I have tried. I believe I have followed all the rules of the system as per the screen cast and have found I don't get anywhere near the results shown by Cubbybgood....
Ignored
Generally, the rules are ok. I would specify the following lines:
previous bar was an inside bearish bar
the current Bid is above the RMI -> RMI of inside candle closed above 70
Although your screenshots show different settings for RMI, I guess the main reason is an issue with your code.
Additionally, I would strongly recommend not to use control points for testing, as this is prone to misleading results.
{quote} Generally, the rules are ok. I would specify the following lines: previous bar was an inside bearish bar the current Bid is above the RMI -> RMI of inside candle closed above 70 Although your screenshots show different settings for RMI, I guess the main reason is an issue with your code. Additionally, I would strongly recommend not to use control points for testing, as this is prone to misleading results.
Ignored
osfx,
Yes I did have the inside bar as bearish in the rules I used, and effectively the trade is opened only if the Close of the inside bar coincides with the RMI in the 70+zone. Thanks for confirming this, a great help.
In your experience do you think the failure of my testing is due to not portfolio back testing? If I was testing multiple currencies at the same time, would this offset the loosing periods enough? I am looking for a big difference to understand why I cant replicate Cubbybgoods results.
I will take your recommendation for not using control points when getting closer to a final code. This system should be able to handle entries +or- several pips and still be successful.
I have watched the tester take trades and it follows all logic OK, but keeps getting smashed on a series of 500 pip stop losses which happen regularly enough to make the system nonviable.
Thanks again for answering my questions.
Hi Blix from memory the GBPCAD chart was a 30 min chart not H1, it might be worth doing the analysis on the 30 min chart to compare the results regards Craig
Ignored
Thanks Craig,
The test was performed on the 30 min. The chart I attached was scaled out 1HR so I could show the type of price action that was causing the loosing streaks.
I have also tested 15m 30m 1hr 4hr
I have also tested limiting number of entries to 5,10,15,20,etc
I will keep plugging away to see if I can work out what might help achieve Cubbybgoods results.
{quote} osfx, Yes I did have the inside bar as bearish in the rules I used, and effectively the trade is opened only if the Close of the inside bar coincides with the RMI in the 70+zone. Thanks for confirming this, a great help. In your experience do you think the failure of my testing is due to not portfolio back testing? If I was testing multiple currencies at the same time, would this offset the loosing periods enough? I am looking for a big difference to understand why I cant replicate Cubbybgoods results. I will take your recommendation for...
Ignored
Hi Blix,
GBPCAD alone should provide good results with the original settings. Take a look at my post 110 - there is the test result with the original setttings from 2011/11 to 2017/06. There are some drawdowns on the way, that's part if the game, but by far not that frequent as in your test.