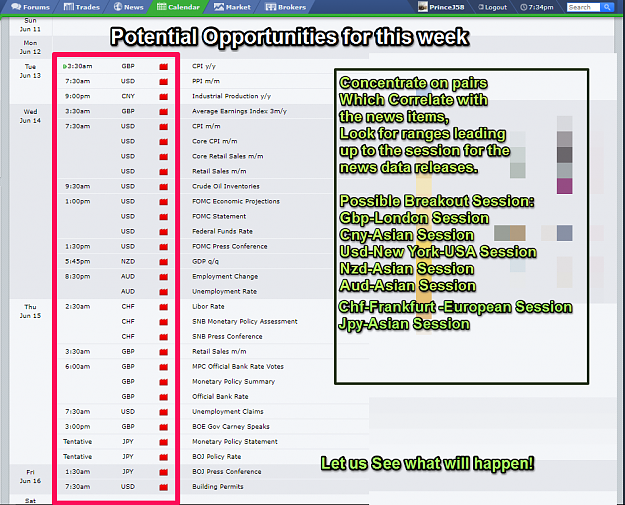
For some experiment:
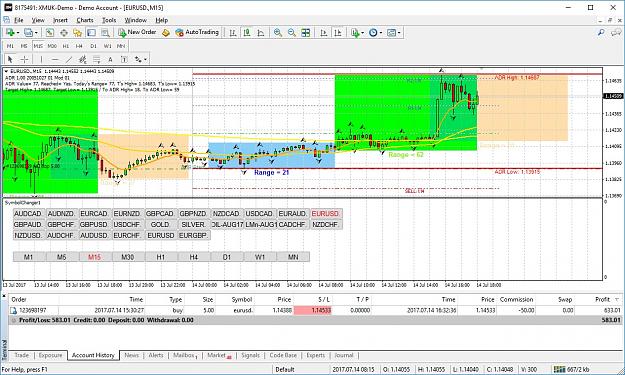
Add EMA 200, 50, 9 to the chart observe the direction on h1-h4 timeframe for direction bias.
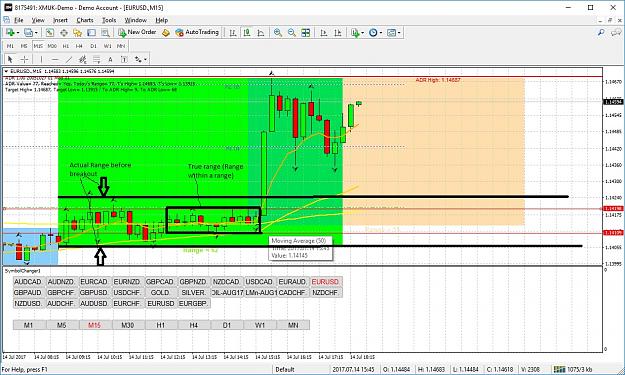
Look for price to break in that direction and lets see if we eliminate the false breaks to the opposite side.
The only thing that will be a challenge is if there is a trend change.
Next thing:
Try MACD 12, 26, 9 or any other periods to see if it can help with entry.
RSI 14- above 50 uptrend and below 50 downtrend on h1, h4.
Entry and stoploss:
Entry 10-15 pips just the same
Take profit Minimum should be 50 Pips
Stoploss should be below the last h4 lower fractal for a buy and above the last 4 hour for a sell.
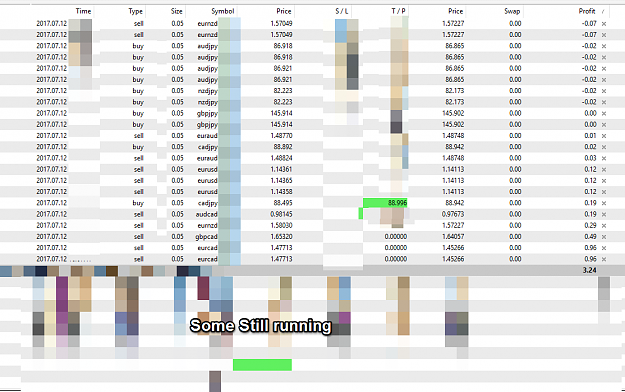
Lets play around these parameters to see if we can pick up some similarities to the long runners.
Cheers.
Add EMA 200, 50, 9 to the chart observe the direction on h1-h4 timeframe for direction bias.
Look for price to break in that direction and lets see if we eliminate the false breaks to the opposite side.
The only thing that will be a challenge is if there is a trend change.
Next thing:
Try MACD 12, 26, 9 or any other periods to see if it can help with entry.
RSI 14- above 50 uptrend and below 50 downtrend on h1, h4.
Entry and stoploss:
Entry 10-15 pips just the same
Take profit Minimum should be 50 Pips
Stoploss should be below the last h4 lower fractal for a buy and above the last 4 hour for a sell.
Lets play around these parameters to see if we can pick up some similarities to the long runners.
Cheers.
R:R "Percentage Focus"