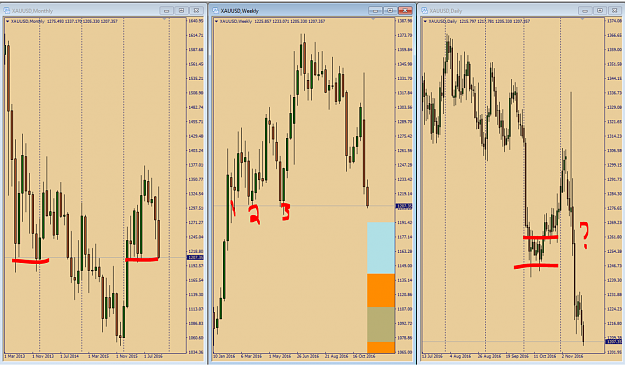
Update on Gold - Long: {image} Gold stopped out with a nasty 350 pips loss...OUCH! I played this one wrong. I didn't let a signal appear, and if I had this loss would not have occurred.
Ignored
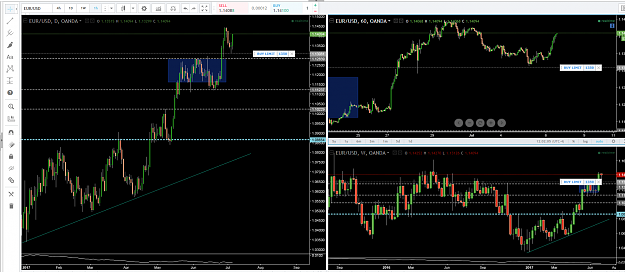
Why did you feel this was an invalid entry in your eyes? It was an obvious level that buyers came in. I would have preferred entry from the areas I marked out as 1,2,3. But according to what you've shown so far it looks like your entry is keeping in line with your method. Price balances, breaks, retraces then entry.
{quote} Why did you feel this was an invalid entry in your eyes? It was an obvious level that buyers came in. I would have preferred entry from the areas I marked out as 1,2,3. But according to what you've shown so far it looks like your entry is keeping in line with your method. Price balances, breaks, retraces then entry. {image}
Ignored
I realized after posting this that the areas I marked originally were where price was at now, or at least when you posted this chart. You got long up above that. Where it's as now is definitely a more key area. But I re-marked the chart where you got long, there were little buy areas there so an argument could be made for Longs off of that area.
But based on your rules why don't you feel that was a legitimate set up?
{quote} Why did you feel this was an invalid entry in your eyes? It was an obvious level that buyers came in. I would have preferred entry from the areas I marked out as 1,2,3. But according to what you've shown so far it looks like your entry is keeping in line with your method. Price balances, breaks, retraces then entry.
Ignored
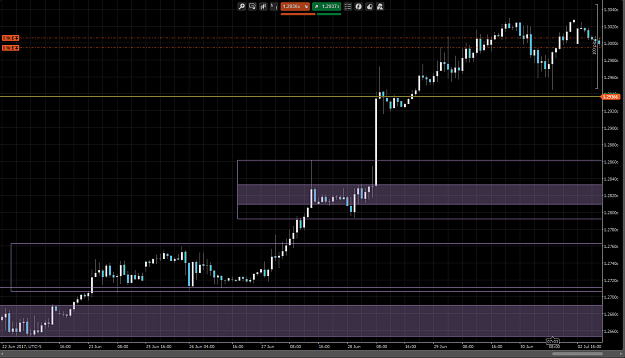
These are very, very good questions and observations you've made here...and frankly it is exactly the type of discussion I was hoping to generate in this thread. The trade you point out here is exactly the kind of trade that has me scratching my head from time to time on either a way to avoid a loser or how to take advantage of the counter trend move. The latter was the case (as it turned out) on this trade.
The big clue on this was the weekly chart...the chart on the left. It is clear that a new higher high formed and I should be looking for a higher low, and jump on the long side when I think that higher low has been established. Of course to do that I need to watch a smaller time frame and somehow "predict" where (what price level) that low may form. The most obvious answer is the area I did enter, and where you point out with the clear supply/demand method you rely on. I too looked at this area, but if you will notice on the chart I had there...I was actually looking for a zone a little bit deeper, where you will see colored boxes drawn in on the middle chart. That is the "zone" where I expected price to move into and then reverse. As it turned out that is exactly where it moved to.
In addition, note that on the weekly chart that higher high took 3 weeks to form. It has been my experience that the longer price stays in a particular area, moving back and forth, the more likely that area will turn out to be a top or a bottom. So when price came down off that area, my play might have been better off trading with the still overall bearish larger time frame, and looking for a higher low...instead of trying to anticipate a higher low that may or may NOT form. So in that respect I didn't quite follow my system, and while the lower time frame did indeed show a "legitimate" set up the premise of bullish follow-through was incorrect...in retrospect.
Finally, one of my rules is that I must see price move into my "target zone", the area where I anticipate a change in the order flow, and THEN actually see a change in order flow...then a signal. But I jumped the gun and didn't look at the larger picture as I was so focused on trying to catch an emerging bullish trend, I missed the better opportunity for what should've been a very profitable short, with the added bonus of a possible "stop and reverse" opportunity to catch the actual higher low when it finally did appear.
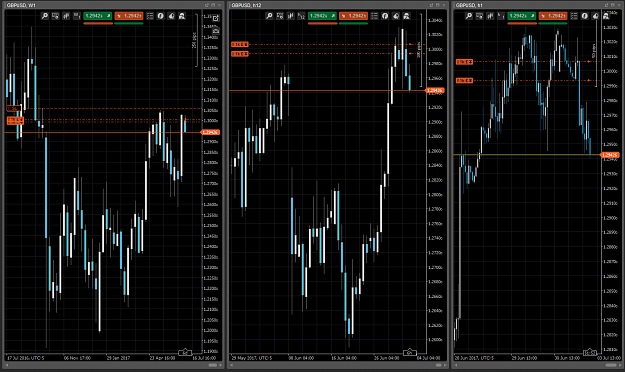
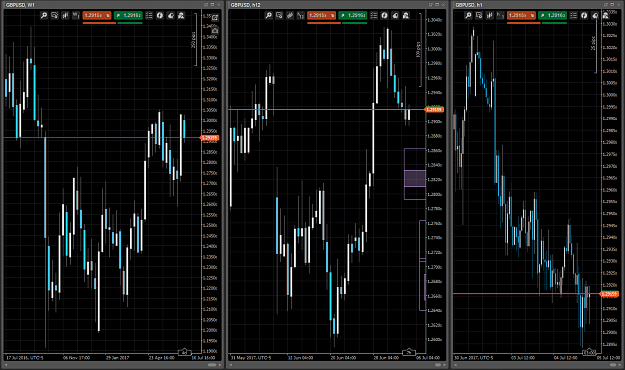
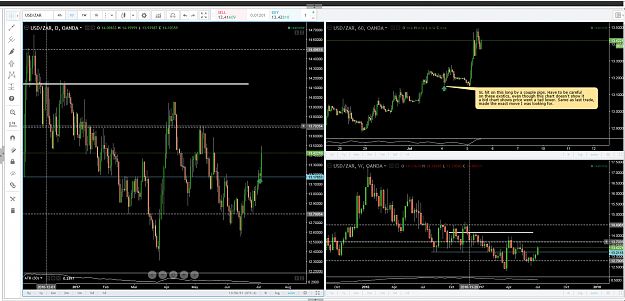
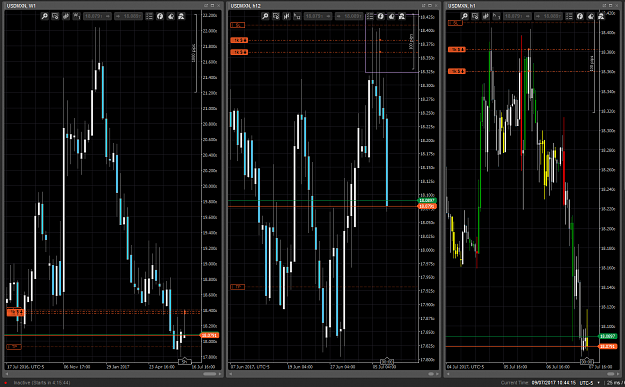
Weekly chart (on left) shows price has returned to an area where sellers took dominance, and while buyers did push price into the area this is the second attempt to push through and it appears to be falling short...(no pun intended).
The 12 hr chart (in the middle) is showing price now at the bottom of a balance area, after a close that has completely canceled out the last push higher. The intraday chart (on right) shows price has stalled at the bottom of this intraday range and may fake downward and then push higher to to retest the highs.
I have placed pending orders in the area where sellers clearly overcame buyers both on intraday and on 12 hr perspective. Also note how these order align almost perfectly on the longer term perspective with where the sellers pushed down through a floor on the weekly chart.
As we have formed a higher high recently (on the weekly) I am cautious around the 1.2780 level, and will be vigilant for volatility, but if we push through, we should be clear for a run to test 1.2500...
Something to chew on...GBP/USD short pending: {image} Weekly chart (on left) shows price has returned to an area where sellers took dominance, and while buyers did push price into the area this is the second attempt to push through and it appears to be falling short...(no pun intended). The 12 hr chart (in the middle) is showing price now at the bottom of a balance area, after a close that has completely canceled out the last push higher. The intraday chart (on right) shows price has stalled at the bottom of this intraday range and may fake downward...
Ignored
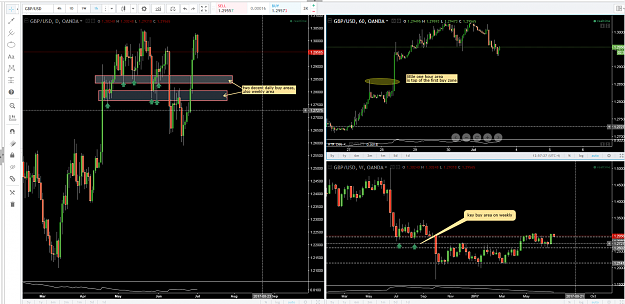
I see what you're saying on G/U, definitely at a key level, or bouncing off a key area.
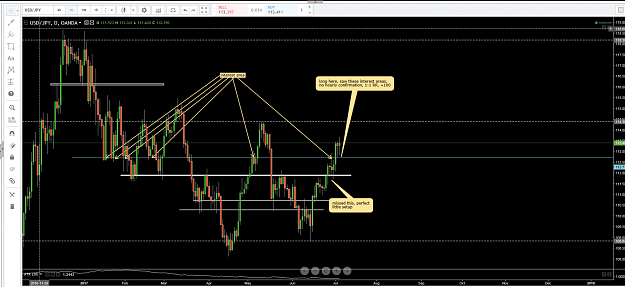
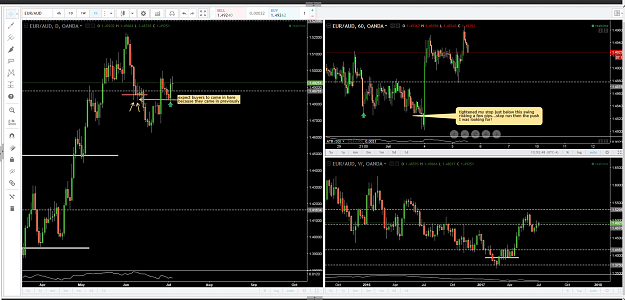
Since I look at Daily for my direction bias based on market structure I'm more interested in a long from further down. See chart. I don't trade counter trend to daily structure BUT If I did I would be looking right where you have your orders. I guess I typically get in when it's balancing and look to catch the first run out whereas you're looking to get in after the first run out. Can't say one's more right or wrong...maybe just more aggressive...?
You and I draw the zones just slightly differently, but they actually end up in pretty much the same place...again I believe the premise is what causes the area where we look for changes...supply/demand or changes in order flow, not necessarily semantics.
Attached Image (click to enlarge)
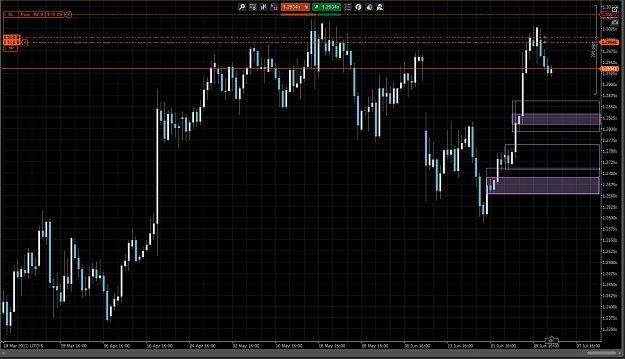
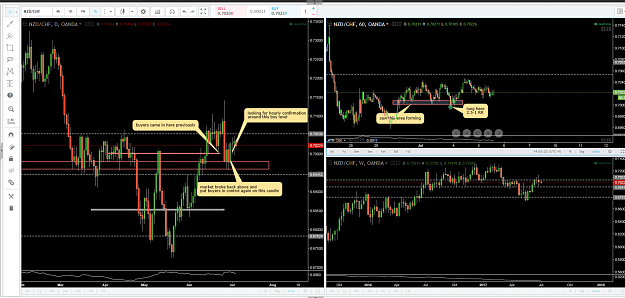
Each of the boxes draw on this chart represent areas where the buying volume clearly overwhelmed that of selling. Also note how in each of these areas price stalled and "balanced" a bit before moving on. If you had looked at those areas on a smaller time frame, it would look like a reversal or a range but as the order flow stayed dominant on the buying side any bearish "reversal" in price on the intraday charts was where the opportunity to buy against those sellers.
Attached Image (click to enlarge)
So, as price comes back into these areas, I will be looking for the same to occur...somewhere within these zones...selling dominance --> balance; balance --> buying dominance; retest and trigger entry.
Price has continued dropping on this market. While I would characterize it as more of a "meandering" down, it has gone beyond the time that I would expect a retest to occur to trigger my orders. Thus I have cancelled them.
For those interested, it would appear there is a bullish flag now forming on the intraday charts. While I do not necessarily use that to trade it does tell me something of the order flow. NO VOLUME! There does not seem to be anyone interested in this market...buyers or sellers. Of note however, is that each time the prices rise intraday, the market is sold off again quickly. This tells me that most of the trading is scalping and day traders, which also explains the lack of volume.
I am watching the zones I drew in yesterday, and will be very interested in what happens later this week with NFP. For now, I'm flat again.
You and I draw the zones just slightly differently, but they actually end up in pretty much the same place...again I believe the premise is what causes the area where we look for changes...supply/demand or changes in order flow, not necessarily semantics. {image} Each of the boxes draw on this chart represent areas where the buying volume clearly overwhelmed that of selling. Also note how in each of these areas price stalled and "balanced" a bit before moving on. If you had looked at those areas on a smaller time frame, it would look like a reversal...
Ignored
Our zones are in similar areas but it looks like you're looking at just recent data, I'm looking further back in history. On my GBPUSD chart I marked the areas that formed several weeks prior. But I do like to see recent candles confirm the area.
Agreed, I don't like to see the market "meander" or grind towards my entry, I like to see price make a run towards it and snap back showing strong sellers/buyers/
Hi Don Pato, well done, nice method of trading, i do like to ask if you use a method to measure or know which currency is strongest or weakest...or you do not use such methods. i feel such will enhance this method. Thank you.
I've been back and forth between using a single time frame and multiple over the years. Over this last year it became clear that any time frame really isn't..."enough" as price is outside of time. I've thought through how to look at price outside of time, as a time frame is relative but price isn't but haven't really found a unique way of viewing the market this way. It seems multiple time frames help with this somewhat, but we're still looking at a confined picture of price. But I guess there's no way outside of that other than just watching a quote screen...
I've been back and forth between using a single time frame and multiple over the years. Over this last year it became clear that any time frame really isn't..."enough" as price is outside of time. I've thought through how to look at price outside of time, as a time frame is relative but price isn't but haven't really found a unique way of viewing the market this way. It seems multiple time frames help with this somewhat, but we're still looking at a confined picture of price. But I guess there's no way outside of that other than just watching a...
Ignored
This concept is something we all struggle with. In my opinion (such as its worth), multiple time frames is the only way to truly view how the market is expressing itself. It is difficult to keep in mind that the market itself is just a machine. A computer (or farm of computers) matching orders with each other...buys and sells. Thus it is really people or participants that "create" the market. As such, not everyone agrees on the concept of "when", which, is of course what we are MOST concerned about when wondering..."when should I enter?"..."when should I exit?"..."when should I stand down?"...etc
The only concept I can think of that works for me is that of music. (Since I was a music major in College). The concept of the Fugue works best. But to understand that you must understand what a Fugue is. Here is the dictionary definition: https://www.merriam-webster.com/dictionary/fugue
However I find it more meaningful to hear a fugue. J.S. Bach was the inventor an a true genius at writing them:
Inserted Video
What you notice in listening to these pieces is that there is an introductory theme in the music that is repeated over and over by different "voices". High tones, low tones, middle tones...etc. If you train your ear to hear the introductory theme, you will also hear it repeat itself across the spectrum of audio ranges. Once you recognize the theme you will know its rhythm, its tones, and which tone comes next in the theme.
The market is the same way, (again in my opinion). It is constantly repeating a theme over and over. Sometimes it is on large time frames and sometimes it is on very short time frames, and still others on middle time frames. All that is needed is to learn the theme well, and all its nuances. Then when it starts you will recognize it and know what comes next, and where to expect it. And, just like a fugue often times the themes on a smaller time frame are intermingled with a larger theme playing out on a large time frame...that is what the mathematicians refer to as "fractal" expression. Since I am more of an arts major and not a science major...I am more comfortable with the music analogy.
That theme? What is it? As I explained earlier...balance-->dominance; dominance -->balance...over and over.
Thus to truly "see" the order flow you must think NOT in terms of what time frame should I trade, but more in terms of which time frame is the markets theme expressed most clearly? And always keep in mind that this theme repeats and is intermingled with other time frames. It is complex, amazing and (in my opinion) beautiful. Like gazing at a universe of galaxies, stars, and planets and finally understanding the role gravity plays in guiding all of this matter to interact. Complex, amazing, and in the end, beautiful.
Sorry for the esoteric nature of my response here but this is the only way I've been able to make sense of something so complex and see it clearly...since then I have never been able to NOT look at multiple time frames, because I feel the view is only one dimensional.
Hi Don Pato, well done, nice method of trading, i do like to ask if you use a method to measure or know which currency is strongest or weakest...or you do not use such methods. i feel such will enhance this method. Thank you.
Ignored
Hello Carbonado...The concept of "strength" or "weakness" to me is irrelevant, when trading the order flow. Those two terms become painfully obvious when price moves one direction or the other. These terms are used mostly by economists when trying to "label" or compare one country's economy to another. So what in effect you are trying to do with this concept is determine "why" a certain currency may be moving a certain direction...
First of all, in this business, we will never know "why" a trader or a group of traders places their orders or in which direction. Thus, most of the "why" a price moves is speculation based on the PAST. This, by its very nature is useless to us. We don't care about the past....because we cannot go back in time.
We must concentrate on what is happening NOW...and link all the "now moments" together into a line that takes us into the future. Order flow is the only thing that does that.
Learning to understand what is happening now helps us understand what may happen next, and the WHY of price movements. Price rising? it is because more buying volume is coming into the market than selling volume can balance. Price falling? It is because more selling volume is coming into the market than buying volume can balance. Price ranging? Both buying and selling volumes are approximately evenly matched.
Thus, for example, the US economists say the US economy is "stronger" than the Mexican economy. Therefore, you should see the USD rise against the MXN (mexican peso)...however that has NOT been the case all this year. The USD is falling against the MXN. WHAT???
So should I have been buying the USD all year, and losing my shirt just because one economy is "stronger" than the other? Of course not...Instead I look and see what the order flow is looking like and follow that...
{quote} Hello Carbonado...The concept of "strength" or "weakness" to me is irrelevant, when trading the order flow. Those two terms become painfully obvious when price moves one direction or the other. These terms are used mostly by economists when trying to "label" or compare one country's economy to another. So what in effect you are trying to do with this concept is determine "why" a certain currency may be moving a certain direction... First of all, in this business, we will never know "why" a trader or a group of traders places their orders...
{quote} This concept is something we all struggle with. In my opinion (such as its worth), multiple time frames is the only way to truly view how the market is expressing itself. It is difficult to keep in mind that the market itself is just a machine. A computer (or farm of computers) matching orders with each other...buys and sells. Thus it is really people or participants that "create" the market. As such, not everyone agrees on the concept of "when", which, is of course what we are MOST concerned about when wondering..."when should I enter?"..."when...
Ignored
Don,
Perfect concept to capture the fractal-ness of the market. I've played guitar for about 15 years so can relate will with a music analogy. You can almost see "charts" and different time frames in that video, the same progression within itself.
{quote} Don, Perfect concept to capture the fractal-ness of the market. I've played guitar for about 15 years so can relate will with a music analogy. You can almost see "charts" and different time frames in that video, the same progression within itself.
Ignored
I'm so glad you understand that concept...many who do not have any kind of musical background look at me with a kind of "puppy-dog" look with their head cocked to one side...trying to understand but not comprehending.
I hope this answers the question of which time frame you should watch...all of them.
I spread my time frames out by a factor of 10 (or as close as I can come to it). That why the weekly chart is my base. 7200 min. divided by 10 is 720 min (12 hrs)...again divided by 10 is 72 min but I use the hourly instead. Since I'm using the 12 hr chart as my trading "window" I don't feel it necessary to use anything smaller than an hourly chart. But sometimes I will go up and look at a monthly chart.
As well when I trade commodities, I go with monthly, 2 day, and 4 hr charts.
{quote} I'm so glad you understand that concept...many who do not have any kind of musical background look at me with a kind of "puppy-dog" look with their head cocked to one side...trying to understand but not comprehending. I hope this answers the question of which time frame you should watch...all of them. I spread my time frames out by a factor of 10 (or as close as I can come to it). That why the weekly chart is my base. 7200 min. divided by 10 is 720 min (12 hrs)...again divided by 10 is 72 min but I use the hourly instead. Since I'm using...
Ignored
I was using 8-12HR charts for a while too but felt I could see the same key levels on daily so ended up sticking with that for simplicity.
I caught this right on time, and was able to manually enter the first order. Price is pulling away nicely from the entry point, after giving a bit of a scare earlier this AM. If we start getting the market to close down where price is now, and even lower, I think I will have a winner here.
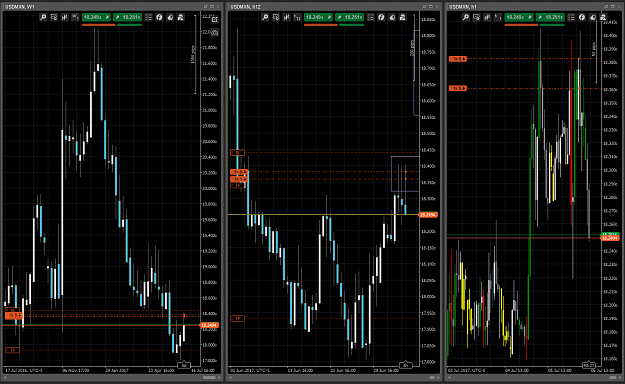
NFP was extremely helpful to this trade, pushing price down to produce a current 300 pip profit. Of note is the "target zone" indicated by the box at the top of the middle chart. Note how price moved in an out of there several times during the balancing process that can be clearly seen on the intraday chart (on the right). As well, during this balancing process, you can see (as indicated by the green colored candles), how buying exhausted itself pretty much every time it entered this area. Further, look on the weekly chart (on the left) and you can clearly see where those entries occurred in the larger price structure, and understand, based on the "supply/demand" model why this method appears correct...but I stress again, that it was the change in order flow on the smaller chart, at the moment price entered an area where sellers had previous taken dominance that was more responsible for my entry in this area...not a "blind" entry based on a line on my chart, but an area where order flow (1) looked like it might change, (2) the order flow actually did change and, (3) produced a signal that I was able to exploit.
I have now moved my stop down to reduce risk to only 40+ pips on the aggregate position. Reduced from approximately 90 pips on the aggregate. I would now anticipate price to once again rise and retest the bottom of that last balance zone before moving significantly lower. I might be surprised though and see price hit my first target....we'll see. Note also that the first target is the bottom of a larger and now fully formed balance zone on the weekly chart.