Cheers Bass. It's great using your thread as a library. Don't ever stop. :-) C
Similar Threads
FXCM Strategy Trader Delivers the Next Evolution in Automated Trading 12 replies
Yuppie's Evolution... 78 replies
Usd Eur Gold And Silver Evolution... 1 reply
The Evolution of a Trader 13 replies
Trading evolution 0 replies
 ETMA_The Evolution
- #1,762
- May 9, 2017 4:29am May 9, 2017 4:29am
- Joined Apr 2011 | Status: Cut Your Losses, Ride Your Winners. | 2,914 Posts
TSSB
TSSB is FREE software platform for rapid R&D of statistically sound predictive model based trading systems via machine learning.
TSSB is FREE software platform for rapid R&D of statistically sound predictive model based trading systems via machine learning.
- Development team with over 50 years of experience
- Statistical soundness: trading systems likely to perform well in the future
- Rapid prototyping of trading systems without any programming
- Objective functions based on financial performance rather than statistical fit
- Systems based on machine learned predictive models, not human proposed rules
- Walk-forward & cross-validation fully integrated
- Over-fit suppression for superior out-of-sample generalization
- Out-of-sample performance stats and p-values free of training or selection bias
- Ensembles & Oracles and regime-specific systems
- Portfolios of trading systems systems
- Statistical significance testing robust to guided search training bias
- Library of over 100 indicator families including wavelets and ARMA
- Dimensional compression via PCA, Linear and Quadratic methods
- Find independent groups of non redundant predictors automatically
- Unique Graphics including predictive heat-maps
Why Use Specialized Software Like TSSB for Trading System Development?
While its possible to use general-purpose statistical modeling / data mining platform to develop and test predictive model based financial instrument trading systems, it is not efficient. There are many steps involved:
- Generate indicator and target variables
- Create model-building methods to produce a predictive model from a specified training set
- Apply this model to a test set of data
- Export predictions to a spreadsheet program
- Convert predictions to signals
- Compute financial performance statistics
This process is awkward, tedious, and its lack of versatility means there are limited applications. Trading system R&D is best done with software written specifically for this task.
A professional Trading System development platform must, at a minimum to the following:
- Compute a wide variety of predefined indicators and targets, saving the user from the need to program them or purchase additional specialized software
- Provide a scripting language allowing users to create variables not predefined, and modify existing variables
- Permit development and testing of trading systems and signal filters for existing systems
- Permit a range of architectures from simple to complex
- Process daily and intra-day data
- Process single or multiple markets, including the ability to compute cross-sectional (pooled) indicators
- Export standard format databases to other programs and read externally produced databases
- Provide a wide variety of modeling methods allowing users the best combination of power, speed, and resistance to over-fitting
- Permit automated indicator selection from a large list of candidates
- Provide a wide and useful variety of optimization criteria (modeling objective functions) including financial performance
- Permit development of regime-specific trading systems
- Training and testing of trading systems that specialize in specific regimes such as high or low volatility, up or down trends, and more
- Provide cross validation and walk-forward testing at a variety of granularities (day, month, year, etc.)
- Report predictive accuracy and financial performance statistics individually for every fold
- Training set (in-sample)
- Out-of-sample data individually for every fold
- Pooled out-of-sample results
- Offer statistical significance testing for financial performance statistics where possible
- Preserve predictions for examination within the program and for export to other programs
- Allow ensembles (committees) and Oracles to be developed seamlessly
- Generate graphics to study variables and their relationships
- Permit development of long and short market neutral strategies
TSSB has all of these capabilities and many more critical in the development and testing and unbiased evaluation of predictive-model trading systems and signal filters.
There are numerous challenges in Trading System development:
- Non-stationarity and shifts in regime
- Curse of dimensionality
- Low Signal/Noise ratio
- Low information content of predictors
- Ease of over-fitting
- Poor Out-of-Sample generalization
TSSB has numerous features to cope with these issues and many others!
Click to follow our
Work Flow Diagrams
http://www.tssbsoftware.com/product_info/workflow.gif
http://www.tssbsoftware.com/product_...reparation.gif
http://www.tssbsoftware.com/product_info/explore.gif
http://www.tssbsoftware.com/product_info/modeling.gif
http://www.tssbsoftware.com/product_info/committees.gif
http://www.tssbsoftware.com/product_info/oracles.gif
http://www.tssbsoftware.com/product_...ialization.gif
http://www.tssbsoftware.com/product_...ization_ex.gif
http://www.tssbsoftware.com/product_info/construct.gif
http://www.tssbsoftware.com/product_...erformance.gif
There are two key pieces of information that every Trading System developer needs:
- Un-biased estimate of system performance
- Statistical significance of performance (p-value
- The probability that a worthless trading system could have performed as well
TSSB provides both!
- Unbiased performance estimates: based on walk-forward and cross-validation
- P-values generated by unique Monte-Carlo Permutation test
- Application to Trading System Development pioneered by Hood River Research Inc.
- Works for trading systems developed via guided (intelligent search such as step-wise, GP or GA)
- Prior methods are only effective for exhaustive and/or random searches
Attached Image

Master Your Setup, Master Your self. (NQoos)
- #1,763
- May 9, 2017 4:33am May 9, 2017 4:33am
- Joined Apr 2011 | Status: Cut Your Losses, Ride Your Winners. | 2,914 Posts
Trading a System Developed in TSSB
At this time we have not yet completed a simple and elegant method for real-time trading of a system developed in TSSB. However, there are several possible (though admittedly awkward) ways to trade these systems in the current incarnation of the program:
At this time we have not yet completed a simple and elegant method for real-time trading of a system developed in TSSB. However, there are several possible (though admittedly awkward) ways to trade these systems in the current incarnation of the program:
- If you are doing end-of-day trading for 'next day' moves and the training time of your system is not excessive (fast training time is the most common situation), then you would update the market history as of the end of the day, but with two additional ‘fake’ market records. Execute the TRAIN command, and execute the WRITE DATABASE command. This will produce a standard text file containing, among other things, the predicted market movement for the next day. The log file produced by training will list the thresholds for taking long and short positions. Compare the predicted market movement to these thresholds and take a position accordingly. This method is a nuisance because the user must append fake ‘tomorrow’ records to the market history file(s). But the advantage of this method is that the full power of all TSSB models and committees can be invoked in the trading decisions.
About the need for two fake records...
Assume that we are doing one-day-ahead predictions. (Adjust as needed for other targets.)
TSSB predicts the change from tomorrow morning to the next morning. For example, suppose we have closed trading day 10. We predict the change from the open of day 11 to the open of day 12.
Again, suppose we have just closed day 10. Then the most recent case in the database can be day 8, which has as its target the change from day 9 to day 10, and the most recent day we have is day 10.
There is no way that day 9 could be in the database, because it would need the open of day 11 and we are not there yet.
So at the close of day 10, we would need to append two fake records (just duplicate day 10) for day 11 and day 12.
This way, the most recent record in the database will be for day 10, which will include the predicted day 11 to day 12 change based on history ending at day 10. This, of course, is what we need for realtime trading. - If your trading system involves only indicators that can be computed in a program such as TradeStation (you imported them into TSSB, which is easy), and if your TSSB system involves only simple constructs such as linear regression, principal components, and average or constrained committees, it is very simple to program them into TradeStation in a short EasyLanguage script. The log file produced by TSSB provides all necessary weights and thresholds. In this way, simple trading systems developed in TSSB can be actively traded on more conventional platforms, though some busywork is required reading the TSSB log file and typing the appropriate figures into EasyLanguage or whatever other trading tool is desired.
These are the only two possibilities with the current version of TSSB. However, we are currently designing an easy-to-use TradeStation interface. The user will develop a trading system in TSSB and then export the entire set of rules (models, committees, thresholds, et cetera) in a single file. This file would be automatically read when TradeStation starts, and the user would then have access to a single indicator in TradeStation that takes the value +1 when a long position is to be opened, -1 when a short position is to be opened, and 0 when the trader is supposed to be neutral. A delivery date for this TradeStation interface is dependant on funding from TSSB users. We are able to furnish a quote for this enhancement. Interested parties should contact David Aronson via the contract page.
Include trading costs in model development and performance results
Trading costs can have a profound impact on the nature of optimized models, and their effect really should be included in reported performance figures. For example, significant trading costs will favor models that make fewer but more reliable trades compared to models developed without accounting for trading costs. Also, if a developed trading system makes numerous trades, slippage and commissions can easily convert a highly profitable system into a losing system.
Hidden Markov Models for regime classification
Expecting a single model to effectively handle many different market regimes (high versus low volatility, strong trends versus flat markets, et cetera) is unrealistic. The best prediction systems specialize in a single regime. Our current method of defining regimes (via Oracles, event triggering, and split linear models) employs a fixed threshold on a variable. This method, while respectable and useful, is not optimal. It would be much better to base regime definitions on multiple variables, with their correlation taken into account. Also, HMM models allow for transition probabilities, which discourages whipsaws on the boundary of different regimes. By employing optimally estimated probabilities that a regime will remain in effect or change to another, we can discourage rapid, repetitive shifting of in and out of regimes, a capability which TSSB does not currently possess.
Relative Strength Indicators Described by Gary Anderson in “The Janus Factor” (Bloomberg Press 2012)
Our initial explorations into this fascinating family of relative performance indicators shows considerable promise. We propose adding at least the most fundamental members of this family to the TSSB library. They would be a powerful enhancement for the development of trading strategies that are based on ranking sectors or individual issues within a stock universe.
Display confidence bands on plotted equity curves
It would be nice to overlay confidence bands on the equity curves that we plot. This would let the user visually assess the relevance of out-of-sample equity curves. For example, if the curve is impressive and the confidence bands are tight, the user would be encouraged. However, if the lower confidence band is close to flat, or even shows a loss, the user would not be nearly as impressed by a quickly rising equity curve.
Develop models based on benchmarked performance
Many developers believe that one should take advantage of long-term market trends when developing a trading system. For example, one might favor long positions when trading equity markets that have a long-term upward bias. However, many others believe that removing the position-biasing effects of secular trend reveals the true predictive power of models. Under this philosophy, models should be developed that maximize performance without taking advantage of trends. There are methods for separating the performance of a trading system into two components: that due to favoring positions that take advantage of the secular trend, and that due to true predictive power. Currently, TSSB bases its indicator selection as well as its optimized trading thresholds on the total of these two quantities. We propose adding the option of TSSB choosing indicators and trading thresholds based on true predictive power alone, uncontaminated by position bias due to trend. This will be done by optimizing performance relative to a benchmark that is based on the interaction between trend and position bias.
P-values for OOS performance based on equity curves
In order to properly assess the performance of a trading system, we need to compute two quantities: an unbiased estimate of future performance, and the probability (p-value) that a truly worthless system would have performed as well as our system did in back-testing. TSSB currently has several excellent algorithms for providing unbiased estimates of future performance. It also has several methods for computing p-values:
- A Monte-Carlo Permutation Test estimates p-values when the target looks ahead one day. This test is invalid for look-aheads greater than one day.
- The tapered-block bootstrap and stationary bootstrap in TSSB can theoretically handle any look-ahead, but in practice they are notoriously unreliable.
- Permutation training provides p-values for the entire historical dataset. But it is extremely slow, sometimes prohibitively slow. Also, because it includes historical data prior to the walkforward OOS period on which unbiased future performance estimates are based, it can be misleading. For example, suppose we want to develop our system using data from 1995-2012, and we want the walkforward test to start at 2005. We may find that the p-value is significant, and the OOS-based expected future performance is excellent. That sounds promising. But what if the significant p-value comes strictly from pre-2005 data? The data that provided the good p-value and the data that provided the good unbiased performance estimate do not overlap!
Thus, we see that none of TSSBs current methods for estimating p-values are ideal. We suggest adding another alternative: base p-values on the equity curve obtained in the OOS period. This will handle targets with any look-ahead distance, and it ensures that the p-values are based on the same time period that was used for unbiased estimates of future performance. As a final bonus, this will also handle OOS-type portfolios, although not as well as walkforward permutation described in the next section.
Walkforward testing with permutation
Our existing permutation training is a powerful way of estimating p-values for training-set performance. However, this decouples the p-values from the expected future performance produced by walkforward testing. This effect, described in “P-values for OOS performance based on equity curves” above, is problematic. In other words, permutation training computes p-values based on the entire available market history (training plus OOS periods), while walkforward testing estimates expected future performance based on only the OOS period. It is not good to have them be separate time periods. Ideally they should both cover the same time period to avoid a situation of a significant p-value being obtained strictly from activity that preceded the OOS period. A solution to this problem would be extending permutation to walkforward testing. This would directly link the unbiased estimate of future performance to p-values for it. Also, permutation training cannot compute p-values for portfolios that are selected based on out-of-sample performance of the component trading systems. Walkforward permutation would overcome this limitation by correctly and efficiently compensating for the selection bias inherent in portfolio construction. What is the advantage of walkforward permutation over computing p-values based on equity curves, as described above? Simply put, the p-values computed by walkforward permutation will in most cases be more accurate than those computed by means of equity curves. This difference can be substantial in some situations.
Note on “P-values for OOS performance based on equity curves” versus “Walkforward testing with permutation”
The two options described above do essentially the same things:
- They compute p-values for the OOS period, which the current version of TSSB cannot do well in a general sense..
- They take into account selection bias from OOS-type portfolios, which the current version of TSSB cannot do at all.
However, they perform these tasks in completely unrelated ways, and each has its own advantages and disadvantages:
- The equity-curve method will execute very much faster than the walkforward permutation method
- The equity-curve method facilitates plotting confidence bands on equity curves.
(These two tasks share much code, so programming them simultaneously would be efficient.) - In most situations, the permutation method will provide p-values that are considerably more accurate (less random error in their computation) than the equity-curve method, making them more valuable.
The bottom line difference between the two methods is a tradeoff between execution speed and quality of results.
Logistic and Ridge regression
These are ‘almost-linear’ models that share the benefits of ordinary linear regression (much less likely to overfit than most nonlinear models; easy interpretability) but that are more sophisticated in terms of their ability to handle less than ideal data (noisy targets and correlated predictors).
Improved OPSTRING model
Our current OPSTRING model can be greatly improved by eliminating mathematically pointless candidates before they go into the genetic population pool for evaluation and potential reproduction. This will improve the efficiency of the genetic optimization algorithm. For example, the current version of OPSTRINGs in TSSB may, by random bad luck, include a term such as “X>X+1" in a population. Obviously X can never exceed X plus one. This is a nonsense term because it is always false. It will eventually be weeded out of the gene pool, but until this happens, computational resources will be wasted dealing with it.
Open positions with limit orders
The targets available in the current TSSB library all assume that when a trade is signaled, it is immediately opened with a market order. We could add targets that respond to a trade signal by issuing a limit order which may or may not be executed.
Supercomputer performance on a PC via CUDA processing
Modern nVidia video display cards make their massive parallel processing power available to users via what they call a CUDA interface. The very best nonlinear models such as general regression neural networks can be extremely slow to train, making them impractical for very large problems. Programming CUDA implementations of the best models can speed training by a factor of hundreds, or even thousands, reducing training time from hours to seconds.
More performance statistics
TSSB currently computes and prints a limited set of performance statistics for developed trading systems. Other commercial products display a vast array of statistics. We could add more statistics to the program’s result file.
More optimization criteria for portfolios
TSSB currently selects portfolio members by maximizing the Sharpe Ratio. This is excellent, but many users would like to employ other optimization criteria, such as maximizing return-to-drawdown ratios.
Master Your Setup, Master Your self. (NQoos)
- #1,764
- May 9, 2017 4:49am May 9, 2017 4:49am
- Joined Apr 2011 | Status: Cut Your Losses, Ride Your Winners. | 2,914 Posts
The Financial Hacker
A new view on algorithmic trading
Hacker’s Tools
For performing our financial hacking experiments (and for earning the financial fruits of our labor) we need some software machinery for research, testing, training, and trading financial algorithms. No existing software platform today is really up to all those tasks. So you have no choice but to put together your system from different software packages. Fortunately, two are normally sufficient. I’ll use Zorro and R for most articles on this blog, but will also occasionally look into other tools.
Choice of languages
There’s not as much choice as it seems at first glance. You can avoid a programming language entirely by using a visual ‘strategy builder’, ‘code wizard’ or spreadsheet program for defining your strategy. Unfortunately this works for rather simple systems only, and I never heard of such a system that produced any consistent trading profit. For real development and research tasks, there’s no stepping around ‘real programming’.
You’re also not totally free to select the programming language with the nicest or easiest syntax. One of the best compromises of simplicity and object orientation is probably Python. It also offers libraries with useful statistics and indicator functions. Consequently, many strategy developers start with programming their systems in Python. And eventually they wonder why they’re all the time waiting for their program to come up with results. And this even after having spent a lot of money for really fast computers. There’s another criterion that is more relevant for system development than syntax: execution speed.
Speed mostly depends on whether a computer language is compiled or interpreted. C, Pascal, or Java are compiled languages, meaning that the code runs directly on the processor (C, C++, Pascal) or on a ‘virtual machine’ (Java). Python, R, or Matlab is interpreted: The code won’t run by itself, but is executed by an interpreter software. Interpreted languages are much slower and need more CPU and memory resources than compiled languages. But they have the advantage of being interactive: you can enter commands directly at a console. Some languages, such as C#, are inbetween: They are compiled to a machine-independent interim code that is then, dependent on implementation, either interpreted or converted to machine code. C# is about 4 times slower than C, but still 30 times faster than Python.
Here’s a benchmark table of the same two test programs written in several languages: a sudoku solver and a loop with a 1000 x 1000 matrix multiplication (in seconds):
Language Sudoku Matrix
- C, C++ 1.0 1.8
- Java 1.7 2.6
- Pascal — 4
- C# 3.89
- JavaScript 18.1 16
- Basic (VBA) — 25
- Erlang 18 31
- Python 119 121
- Ruby 98 628
- Matlab — 621
- R — 1738
Why is execution speed so important for trading systems? Strategy development is a mostly empirical method; you’re all the time running tests with variants of your system. Assume that a C-written strategy needs 1 minute for a test run. The same strategy written in EasyLanguage would need about 30 minutes, in Python 2 hours, and in R more than 10 hours! If I had coded the trend experiment in R, I would today still be waiting for the results. You can see why trade platforms normally use a C variant or a proprietary compiled language for their strategies. High-frequency trading systems are either coded in C or directly in machine language.
Even compiled languages can have large speed differences due to different implementation of trading and analysis functions. The same benchmark script, a small RSI strategy from this page, runs with very different speeds on different trading platforms (10 years backtest, ticks resolution):
- Zorro: ~ 4 seconds (lite-C, a C variant)
- MT4: ~ 110 seconds (MQL4, another C variant)
- MultiCharts: ~ 155 seconds (EasyLanguage, a C/Pascal mix)
However, the differences are not as bad as suggested by the benchmark table. There’s a trick for overcoming slow language speed. Even interpreted languages have function libraries that are often written in C/C++. A script that does not have to go step by step through historical data, but only calls library functions that process all data simultaneously, would run with comparable speed in all languages. Indeed some trading systems can be coded in this vector-based method (you’ll see an example below in R code). Unfortunately this works only with simple systems, and only for backtests. It can not be used for strategies that really trade.
Choice of tools
Zorro is a software for financial analysis and algo-trading – a sort of Swiss Knife tool since you can use it for all sorts of quick tests. It’s my software of choice for financial hacking because:
- It’s free (unless you’re rich).
- Scripts are in C, event driven and very fast. You can code a system or an idea in 5 minutes.
- Open architecture – you can add anything with DLL plugins.
- Minimalistic – just a frontend to a programming language.
- Can be automatized for experiments.
- Very accurate, realistic trading simulation.
- Native portfolio support (multiple assets, algos, and time frames).
- Has all basic data processing and statistics functions (most included with source code).
- Is continuously developed and supported (new versions usually come out every 2..3 months).
- Last but not least: I know it quite well, as I’ve written its tutorial…
http://www.financial-hacker.com/wp-c...1536629470.png
A strategy example in C, the classic SMA crossover:
function run() { vars Close = series(priceClose()); vars MA30 = series(SMA(Close,30)); vars MA100 = series(SMA(Close,100)); Stop = 4*ATR(100); if(crossOver(MA30,MA100)) enterLong(); if(crossUnder(MA30,MA100)) enterShort(); }
You can see that Zorro offers a very easy trading implementation. But here comes the drawback of the C language: You can not as easy drop in external libraries as in Python or R. Using a C/C++ based data analysis or machine learning package involves sometimes a lengthy implementation. Fortunately, Zorro can also call R functions for those purposes.
R is a script interpreter for data analysis and charting. It is not a real language with consistent syntax, but more a conglomerate of operators, functions, and data structures that has grown over 20 years. It’s not very logically structured and harder to learn than a normal computer language, but offers some unique advantages. I’ll use it in this blog when it comes to complex analysis or machine learning tasks. It’s my tool of choice for financial hacking because:
- It’s free. (“Software is like sex: it’s better when it’s free.”)
- R scripts can be very short and effective (once you got used to the syntax).
- It’s the global standard for data analysis and machine learning.
- Open architecture – you can add modules for almost anything.
- Minimalistic – just a console with a language interpreter.
- Has tons of “packages” for all imaginable mathematical and statistical tasks.
- Is continuously developed and supported by the global scientific community (about 15 new packages usually come out every day).
http://www.financial-hacker.com/wp-c...1536432531.jpg
This is the SMA crossover in R, for a vector-based backtest:
require(quantmod) require(PerformanceAnalytics) Data <- xts(read.zoo("EURUSD.csv", tz="UTC", format="%Y-%m-%d %H:%M", sep=",", header=TRUE)) Close <- Cl(Data) MA30 <- SMA(Close,30) MA100 <- SMA(Close,100) Dir <- ifelse(MA30 > MA100,1,-1) # calculate trade direction Dir.1 <- c(NA,Dir[-length(Dir)]) # shift by 1 for avoiding peeking bias Return <- ROC(Close)*Dir.1 charts.PerformanceSummary(na.omit(Return))
You can see that the vector-based code just consists of function calls. It runs almost as fast as the C equivalent. But it is difficult to read, it had to be rewritten for real trading, and details such as a stop loss had to be omitted since they would not work for a vector-based test. Thus, so good R is for interactive data analysis, so hopeless is it for writing trade strategies – although some R packages (for instance, quantstrat) even offer rudimentary optimization and test functions. They require an awkward coding style and do not simulate trading very realistically, but even then they are still too slow for serious tests. While R functions and packages alone can be pretty fast since they are mostly coded in C, R itself can not replace a serious backtest and trading platform. But Zorro and R complement each other perfectly.
More hacker’s tools
Aside from languages and platforms, you’ll often need auxiliary tools that may be small, simple, cheap, but all the more important since you’re using them all the time. For editing scripts I don’t use Zorro’s SED editor or the R console, but Notepad++. For interactive working with R I can recommend RStudio. Extremely helpful for strategy development is a file comparison tool: You often want to compare trade logs of different system variants and check which variant opened which trade a little earlier or later, and which consequences that had. For this I use Beyond Compare.
Aside from Zorro and R, there’s also a relatively new system development software that I plan to examine closer at some time in the future, TSSB for generating and testing bias-free trading systems with advanced machine learning algorithms. David Aronson and Timothy Masters were involved in its development, so it certainly won’t be as useless as most other “trade system generating” software. However, there’s again a limitation: TSSB can not trade or export, so you can not really use the ingenious systems that you developed with it. Maybe I’ll find a solution to combine TSSB with Zorro.
Links to the latest versions of Zorro and R are placed on the side bar. A R tutorial can be found here and a Zorro tutorial here. German readers can find here an extensive introduction into trading with Zorro.
Master Your Setup, Master Your self. (NQoos)
- #1,765
- May 12, 2017 9:45am May 12, 2017 9:45am
- Joined Apr 2011 | Status: Cut Your Losses, Ride Your Winners. | 2,914 Posts
The easy path is more tempting. The difficult path is more rewarding.
We choose to go to the moon in this decade and do the other things, not because they are easy, but because they are hard, because that goal will serve to organize and measure the best of our energies and skills, because that challenge is one that we are willing to accept, one we are unwilling to postpone, and one which we intend to win, and the others, too. John F Kennedy
We choose to go to the moon in this decade and do the other things, not because they are easy, but because they are hard, because that goal will serve to organize and measure the best of our energies and skills, because that challenge is one that we are willing to accept, one we are unwilling to postpone, and one which we intend to win, and the others, too. John F Kennedy
Inserted Video
Inserted Video
Master Your Setup, Master Your self. (NQoos)
- #1,766
- May 15, 2017 9:31am May 15, 2017 9:31am
- Joined Apr 2011 | Status: Cut Your Losses, Ride Your Winners. | 2,914 Posts
Too many entrepreneurs think if their first business idea is a failure, they aren’t cut out for it. Too many artists assume that if their early work doesn’t get praised, they don’t have the skill required. Too many people believe if their first two or three relationships are bad, they will never find love.
Imagine if the forces of nature worked that way. What if Mother Nature only gave herself one shot at creating life? We’d all just be single-celled organisms. Thankfully, that’s not how evolution works. For millions of years, life has been adapting, evolving, revising, and iterating until it has reached the diverse and varied species that inhabit our planet today. It is not the natural course of things to figure it all out on the first try.
So if your original idea is a failure and you feel like you’re constantly revising and adjusting, cut yourself a break. Changing your strategy is normal. It is literally the way the world works. You have to stay on the bus.
Master Your Setup, Master Your self. (NQoos)
- #1,767
- May 15, 2017 10:27am May 15, 2017 10:27am
- Joined Apr 2011 | Status: Cut Your Losses, Ride Your Winners. | 2,914 Posts
I can't think of something better than this for 10$.
Black Algo Trading: Build Your Trading Robot
Trading Robots: The Comprehensive Course That Turns Beginners Into Skilled Algorithmic Traders (Learn MQL4 Algo Trading)
https://www.udemy.com/build-your-trading-robot/
P.S. I'm not affiliated whatsoever with this course nor i'm making any Marketing or advertising for this guy, but the value for the Money is Huge, really, i can't help but mentioned it, its like a 1:10000 Risk : Reward in our Trading language .
Master Your Setup, Master Your self. (NQoos)
1
- #1,768
- May 16, 2017 8:02am May 16, 2017 8:02am
- Joined Apr 2011 | Status: Cut Your Losses, Ride Your Winners. | 2,914 Posts
Learn Algorithmic Trading: 6 Key Components
Posted on March 10, 2016 by Lucas Liew
Victorious warriors win first and then go to war, while defeated warriors go to war first and then seek to win. Sun Tze.
Finance, Mathematics and Programming.
That is what I used to tell my students when they ask what is required for building algorithmic trading systems. However, those 3 components are vague, and they do not add value to a beginner who wants to learn how to get started in algorithmic trading.
It is more useful to divide the knowledge for building algorithmic trading systems into 6 key components. You need to be acquainted with all of them in order to build effective trading systems.
Some of the terms used may be slightly technical, but you should be able to understand them by Googling.
Note: Some of these do not apply if you want to do High-Frequency Trading.
1. Market Theories
What is it?
Market theories refer to the way the markets work. This entails understanding market inefficiencies, market participants, relationships between assets/products/news/factors and price behaviour.
Why do we need to know it?
Trading ideas stem from market inefficiencies. You will need to know how to evaluate market inefficiencies that give you a trading edge versus those that dont. You also need to learn how to take advantage of these market inefficiencies when they occur.
Keywords to Google
Market inefficiency, price/asset/market relationships, market participants, market microstructure, macroeconomics, market fundamentals, hard arbitrage, soft arbitrage, structured products, order limit book, depth of market, retail traders vs hedge funds/institutional investors, financial exchanges, exchange traded products, over-the-counter, price expectations vs reality, price action and price behaviour.
Medieval Warfare Analogy
This is akin to understanding the battlefield. Knowing what your opponent is doing in this particular battle considering the relevant factors (both your armies, terrain, goals and characteristics of each general).
2. Robot Design
What is it?
Design of an effective portfolio of trading strategies. This entails understanding how automated trading systems work individually and together.
On an individual level, an algorithmic trading strategy consists of 3 core components: 1) Entries, 2) Exits and 3) Position sizing. Youll need to design these 3 components in relation to the market inefficiency you are capturing (and no, this is not a straightforward process).
On a portfolio level (aka multiple strategies running together), youll need to know how to manage a group of algorithmic trading strategies at the same time. Strategies can be complementary or conflicting this may lead to unplanned increases in risk exposure or unwanted hedging. Capital allocation is important too do you split capital equally during regular intervals or reward the winners with more capital?
Why do we need to know it?
Once we find market inefficiencies, we need to find the best way to exploit them. That will require you to have knowledge of how to design trading robots.
You dont need to know advanced maths (although it will help if you aim to build more complex strategies). Good critical thinking skills and a decent grasp on statistics will take you very far.
Design involves testing for market inefficiencies (does the market inefficiency exist?) and building effective trading strategies (can I find a way to take advantage of them?). The former entails market (is it correlation or causation or does it not matter?), statistical and infrastructural analysis. The latter entails idea generation, backtesting (testing expectancy and robustness) and optimisation (maximising performance with minimal curve fitting).
Keywords to Google
Entries, exits, position sizing, money management, idea generation, backtesting, robustness, strategies that adapts to the market, optimisation, curve fitting, walk-forward optimisation, math/statistics for finance, correlation, cointegration, execution cost, performance analysis, portfolio of trading strategies, hedging, risk management, risk exposure and capital allocation.
Medieval Warfare Analogy
Designing, training and equipping your army to beat a specific opponent.
http://blog.algotrading101.com/wp-co...1-1024x595.png
A diverse strategy can handle a variety of market conditions.
3. Coding
What is it?
The method we use to build algorithmic trading strategies.
Why do we need to know it?
To build algorithmic trading strategies.
Choosing a programming language:
If you know which products you want to trade, you should find suitable brokers and platforms for these products. You then need to learn the programming languages for those platforms/backtesters.
If you are starting out and do not know what to trade, I recommend Metatrader 4 (FX and CFDs on equity indices, stocks, commodities and fixed income), Quantopian (stocks only) or Quantconnect (stocks and FX). The programming languages used are MQL4, Python and C# respectively.
Keywords to Google
Coding/programming trading strategies, MQL4, MQL5, EasyLanguage, AFL, Python/C#/C++/R/MATLAB/VBA for finance, Trading Technologies, CQG, MetaTrader 4, MetaTrader 5, Amibroker, NinjaTrader, MultiCharts, TradeStation and broker API.
Medieval Warfare Analogy
Skills to forge swords, craft bows and build catapults.
4. Data Management
What is it?
This entails sourcing and cleaning data to ensure we have accurate data for backtesting and that this data reflects the live trading environment as much as possible.
Why do we need to know it?
Garbage in == garbage out. Inaccurate data leads to inaccurate test results. We need reasonably clean data for accurate testing. Cleaning data is a trade-off between cost and accuracy. If you want more accurate data, you need to spend more resources cleaning/obtaining it.
Issues that lead to dirty data include missing data, duplicate data, wrong data (bad ticks). Other issues that can generate misleading data include dividends, stock splits, mergers, spin-offs, gaps and futures rollovers etc.
Keywords to Google
Data management, data cleaning, data providers, finance data sources, I hate cleaning equities data, data storage, data organisation and maintaining trading data.
Medieval Warfare Analogy
Making sure the intel on the enemy is correct.
5. Risk Management
What is it? (This has slight overlap with 2. Robot Design)
There are 2 main types of risk: Market risk and Operational risk. Market risk involves risk related to your trading strategy. Have you hedged away unwanted risk? Is your position sizing too large? Is your risk exposure to a particular element too high? Does it consider worst case scenarios? What if a black swan event like World War 3 happens?
In addition to managing market risk, you need to look at operational risk. System crashes, loss of internet connection, poor execution algorithm (leading to poorly executed prices or missed trades due to an inability to handle requotes), counter-party risk, broker insolvency and theft by hackers are very real issues.
Why do we need to know it?
We need to protect our downsides. Minimising risk whilst maximising returns is key.
Keywords to Google
Risk management, drawdowns, black swan events, fat-tailed events, hedging, risk exposure, operation risk, software security, secure VPS, auto restart [insert trading softwares name], downtime prevention, poor trade execution, slippage, requotes, counter-party risk and broker insolvency.
Medieval Warfare Analogy
Market risk: Reducing loopholes in the war strategy.
Operation risk: Making sure everything that is supposed to work, works.
http://blog.algotrading101.com/wp-co...1-1024x492.png
6. Live Execution
What is it?
Backtesting and live trading are very different. Youll need to select proper brokers (MM vs STP vs ECN). Forexpeacearmy.com is your best friend when it comes to retail broker reviews (this also applies to brokers offering non-forex products), so make sure you read the reviews there before deciding on a broker.
You need proper infrastructure (secure VPS and downtime handling etc) and evaluation procedures (monitor your robots performance and analyse them in relation to market inefficiencies/backtests/optimisations) to manage your robot throughout its lifetime.
You need to know when to intervene (modify/update/shutdown/turn on your robots) and when not to.
Why do we need to know it?
The past does not predict the future perfectly. There are many issues that can crop up when trading live money. Its essential that you create protocols to regularly monitor the market and your strategies performance. You also need to be prepared to improve/update your strategies and fix problems when they arise.
Keywords to Google
Live trading, trade psychology, trade management, trade execution, VPS (virtual private server), monitoring trading robots, remote access to your trading platform, live performance evaluation, trading broker selection, broker reviews, does my broker screw me over, spread widening, stop hunting, funds get deposited quickly but takes forever to withdraw, broker types, market makers, straight-through processing, electronic communication networks, A-books, B-books, liquidity pools and dark pools.
Medieval Warfare Analogy
How you manage the battle when it actually happens.
Its a Never-Ending War!
Algorithmic trading (or any kind of trading) is a marathon, not a sprint. Keep learning and improving. The trading/investment space is getting incredibly competitive. Many strategies that used to work dont any more. Personally, I think profitable trading systems have a lifespan of about 2-3 years (in general) before others catch on to it. You need to constantly innovate to stay ahead of the game, and innovation takes experience, wits, time, infrastructure and money.
Posted on March 10, 2016 by Lucas Liew
Victorious warriors win first and then go to war, while defeated warriors go to war first and then seek to win. Sun Tze.
Finance, Mathematics and Programming.
That is what I used to tell my students when they ask what is required for building algorithmic trading systems. However, those 3 components are vague, and they do not add value to a beginner who wants to learn how to get started in algorithmic trading.
It is more useful to divide the knowledge for building algorithmic trading systems into 6 key components. You need to be acquainted with all of them in order to build effective trading systems.
Some of the terms used may be slightly technical, but you should be able to understand them by Googling.
Note: Some of these do not apply if you want to do High-Frequency Trading.
1. Market Theories
What is it?
Market theories refer to the way the markets work. This entails understanding market inefficiencies, market participants, relationships between assets/products/news/factors and price behaviour.
Why do we need to know it?
Trading ideas stem from market inefficiencies. You will need to know how to evaluate market inefficiencies that give you a trading edge versus those that dont. You also need to learn how to take advantage of these market inefficiencies when they occur.
Keywords to Google
Market inefficiency, price/asset/market relationships, market participants, market microstructure, macroeconomics, market fundamentals, hard arbitrage, soft arbitrage, structured products, order limit book, depth of market, retail traders vs hedge funds/institutional investors, financial exchanges, exchange traded products, over-the-counter, price expectations vs reality, price action and price behaviour.
Medieval Warfare Analogy
This is akin to understanding the battlefield. Knowing what your opponent is doing in this particular battle considering the relevant factors (both your armies, terrain, goals and characteristics of each general).
2. Robot Design
What is it?
Design of an effective portfolio of trading strategies. This entails understanding how automated trading systems work individually and together.
On an individual level, an algorithmic trading strategy consists of 3 core components: 1) Entries, 2) Exits and 3) Position sizing. Youll need to design these 3 components in relation to the market inefficiency you are capturing (and no, this is not a straightforward process).
On a portfolio level (aka multiple strategies running together), youll need to know how to manage a group of algorithmic trading strategies at the same time. Strategies can be complementary or conflicting this may lead to unplanned increases in risk exposure or unwanted hedging. Capital allocation is important too do you split capital equally during regular intervals or reward the winners with more capital?
Why do we need to know it?
Once we find market inefficiencies, we need to find the best way to exploit them. That will require you to have knowledge of how to design trading robots.
You dont need to know advanced maths (although it will help if you aim to build more complex strategies). Good critical thinking skills and a decent grasp on statistics will take you very far.
Design involves testing for market inefficiencies (does the market inefficiency exist?) and building effective trading strategies (can I find a way to take advantage of them?). The former entails market (is it correlation or causation or does it not matter?), statistical and infrastructural analysis. The latter entails idea generation, backtesting (testing expectancy and robustness) and optimisation (maximising performance with minimal curve fitting).
Keywords to Google
Entries, exits, position sizing, money management, idea generation, backtesting, robustness, strategies that adapts to the market, optimisation, curve fitting, walk-forward optimisation, math/statistics for finance, correlation, cointegration, execution cost, performance analysis, portfolio of trading strategies, hedging, risk management, risk exposure and capital allocation.
Medieval Warfare Analogy
Designing, training and equipping your army to beat a specific opponent.
http://blog.algotrading101.com/wp-co...1-1024x595.png
A diverse strategy can handle a variety of market conditions.
3. Coding
What is it?
The method we use to build algorithmic trading strategies.
Why do we need to know it?
To build algorithmic trading strategies.
Choosing a programming language:
If you know which products you want to trade, you should find suitable brokers and platforms for these products. You then need to learn the programming languages for those platforms/backtesters.
If you are starting out and do not know what to trade, I recommend Metatrader 4 (FX and CFDs on equity indices, stocks, commodities and fixed income), Quantopian (stocks only) or Quantconnect (stocks and FX). The programming languages used are MQL4, Python and C# respectively.
Keywords to Google
Coding/programming trading strategies, MQL4, MQL5, EasyLanguage, AFL, Python/C#/C++/R/MATLAB/VBA for finance, Trading Technologies, CQG, MetaTrader 4, MetaTrader 5, Amibroker, NinjaTrader, MultiCharts, TradeStation and broker API.
Medieval Warfare Analogy
Skills to forge swords, craft bows and build catapults.
4. Data Management
What is it?
This entails sourcing and cleaning data to ensure we have accurate data for backtesting and that this data reflects the live trading environment as much as possible.
Why do we need to know it?
Garbage in == garbage out. Inaccurate data leads to inaccurate test results. We need reasonably clean data for accurate testing. Cleaning data is a trade-off between cost and accuracy. If you want more accurate data, you need to spend more resources cleaning/obtaining it.
Issues that lead to dirty data include missing data, duplicate data, wrong data (bad ticks). Other issues that can generate misleading data include dividends, stock splits, mergers, spin-offs, gaps and futures rollovers etc.
Keywords to Google
Data management, data cleaning, data providers, finance data sources, I hate cleaning equities data, data storage, data organisation and maintaining trading data.
Medieval Warfare Analogy
Making sure the intel on the enemy is correct.
5. Risk Management
What is it? (This has slight overlap with 2. Robot Design)
There are 2 main types of risk: Market risk and Operational risk. Market risk involves risk related to your trading strategy. Have you hedged away unwanted risk? Is your position sizing too large? Is your risk exposure to a particular element too high? Does it consider worst case scenarios? What if a black swan event like World War 3 happens?
In addition to managing market risk, you need to look at operational risk. System crashes, loss of internet connection, poor execution algorithm (leading to poorly executed prices or missed trades due to an inability to handle requotes), counter-party risk, broker insolvency and theft by hackers are very real issues.
Why do we need to know it?
We need to protect our downsides. Minimising risk whilst maximising returns is key.
Keywords to Google
Risk management, drawdowns, black swan events, fat-tailed events, hedging, risk exposure, operation risk, software security, secure VPS, auto restart [insert trading softwares name], downtime prevention, poor trade execution, slippage, requotes, counter-party risk and broker insolvency.
Medieval Warfare Analogy
Market risk: Reducing loopholes in the war strategy.
Operation risk: Making sure everything that is supposed to work, works.
http://blog.algotrading101.com/wp-co...1-1024x492.png
Boom!
6. Live Execution
What is it?
Backtesting and live trading are very different. Youll need to select proper brokers (MM vs STP vs ECN). Forexpeacearmy.com is your best friend when it comes to retail broker reviews (this also applies to brokers offering non-forex products), so make sure you read the reviews there before deciding on a broker.
You need proper infrastructure (secure VPS and downtime handling etc) and evaluation procedures (monitor your robots performance and analyse them in relation to market inefficiencies/backtests/optimisations) to manage your robot throughout its lifetime.
You need to know when to intervene (modify/update/shutdown/turn on your robots) and when not to.
Why do we need to know it?
The past does not predict the future perfectly. There are many issues that can crop up when trading live money. Its essential that you create protocols to regularly monitor the market and your strategies performance. You also need to be prepared to improve/update your strategies and fix problems when they arise.
Keywords to Google
Live trading, trade psychology, trade management, trade execution, VPS (virtual private server), monitoring trading robots, remote access to your trading platform, live performance evaluation, trading broker selection, broker reviews, does my broker screw me over, spread widening, stop hunting, funds get deposited quickly but takes forever to withdraw, broker types, market makers, straight-through processing, electronic communication networks, A-books, B-books, liquidity pools and dark pools.
Medieval Warfare Analogy
How you manage the battle when it actually happens.
Its a Never-Ending War!
Algorithmic trading (or any kind of trading) is a marathon, not a sprint. Keep learning and improving. The trading/investment space is getting incredibly competitive. Many strategies that used to work dont any more. Personally, I think profitable trading systems have a lifespan of about 2-3 years (in general) before others catch on to it. You need to constantly innovate to stay ahead of the game, and innovation takes experience, wits, time, infrastructure and money.
Master Your Setup, Master Your self. (NQoos)
1
- #1,769
- May 17, 2017 8:49am May 17, 2017 8:49am
- Joined Apr 2011 | Status: Cut Your Losses, Ride Your Winners. | 2,914 Posts
Zorro version 1.58
A new Zorro version was released last week, passed the beta test, and can now be downloaded from this direct link: http://server.conitec.net/down/Zorro_setup.exe.
Zorro 1.58 got many improvements and new features, including a HFT simulation and latency test mode. The complete list of new features can be found at http://manual.zorro-project.com/new.htm.
And don't forget: Take money from the rich!
Master Your Setup, Master Your self. (NQoos)
- #1,770
- May 17, 2017 9:40am May 17, 2017 9:40am
- Joined Apr 2011 | Status: Cut Your Losses, Ride Your Winners. | 2,914 Posts
- #1,771
- May 18, 2017 10:00am May 18, 2017 10:00am
- Joined Apr 2011 | Status: Cut Your Losses, Ride Your Winners. | 2,914 Posts
Turtle Exam Questions
Posted on December 26, 2007 by Michael Covel
The following true/false questions were sent out to the second group of Turtles. These questions were used to help decide who was picked and who was not:
1. One should favor being long or being short whichever one is comfortable with.
2. On initiation one should know precisely at what price to liquidate if a profit occurs.
3. One should trade the same number of contracts in all markets.
4. If one has $100,000 to risk, one ought to risk $25,000 on every trade.
5. On initiation one should know precisely where to liquidate if a loss occurs.
6. You can never go broke taking profits.
7. It helps to have the fundamentals in your favor before you initiate.
8. A gap up is a good place to initiate if an uptrend has started.
9. If you anticipate buy stops in the market, wait until they are finished and buy a little higher than that.
10. Of 3 types of orders (market, stop, and resting), market orders cost the least skid.
11. The more bullish news you hear and the more people are going long the less likely the
uptrend is to continue after a substantial uptrend.
12. The majority of traders are always wrong.
13. Trading bigger is an overall handicap to one’s trading performance.
14. Larger traders can “muscle” markets to their advantage.
15. Vacations are important for traders to keep the proper perspective.
16. Undertrading is almost never a problem.
17. Ideally, average profits should be about 3 or 4 times average losses.
18. A trader should be willing to let profits turn into losses.
19. A very high percentage of trades should be profits.
20. A trader should like to take losses.
21. It is especially relevant when the market is higher than it’s been in 4 and 13 weeks.
22. Needing and wanting money are good motivators to good trading.
23. One’s natural inclinations are good guides to decision making in trading.
24. Luck is an ingredient in successful trading over the long run.
25. When you’re long, “limit up” is a good place to take a profit.
26. It takes money to make money.
27. It’s good to follow hunches in trading.
28. There are players in each market one should not trade against.
29. All speculators die broke
30. The market can be understood better through social psychology than through economics.
31. Taking a loss should be a difficult decision for traders.
32. After a big profit, the next trend-following trade is more likely to be a loss.
33. Trends are not likely to persist.
34. Almost all information about a commodity is at least a little useful in helping make decisions.
35. It’s better to be an expert in 1-2 markets rather than try to trade 10 or more markets.
36. In a winning streak, total risk should rise dramatically.
37. Trading stocks is similar to trading commodities.
38. It’s a good idea to know how much you are ahead or behind during a trading session.
39. A losing month is an indication of doing something wrong.
40. A losing week is an indication of doing something wrong.
41. The big money in trading is made when one can get long at lows after a big downtrend.
42. It’s good to average down when buying.
43. After a long trend, the market requires more consolidation before another trend starts.
44. It’s important to know what to do if trading in commodities doesn’t succeed.
45. It is not helpful to watch every quote in the markets one trades.
46. It is a good idea to put on or take off a position all at once.
47. Diversification in commodities is better than always being in 1 or 2 markets.
48. If a day’s profit or loss makes a significant difference to your net worth, you’re overtrading.
49. A trader learns more from his losses than his profits.
50. Except for commission and brokerage fees, execution “costs” for entering orders are minimal over the course of a year.
51. It’s easier to trade well than to trade poorly.
52. It’s important to know what success in trading will do for you later in life.
53. Uptrends end when everyone gets bearish.
54. The more bullish news you hear the less likely a market is to break out on the upside.
55. For an off-floor trader, a long-term trade ought to last 3 or 4 weeks or less.
56. Other’s opinions of the market are good to follow.
57. Volume and open interest are as important as price action.
58. Daily strength and weakness is a good guide for liquidating long-term positions with big profits.
59. Off-floor traders should spread different markets of different market groups.
60. The more people are going long the less likely an uptrend is to continue in the beginning of a trend.
61. Off-floor traders should not spread different delivery months of the same commodity.
62. Buying dips and selling rallies is a good strategy.
63. It’s important to take a profit most of the time.
Short Answer Questions
On the back of the true/false answer sheet, please answer these questions with one sentence each.
1. What were your standard test results on college entrance exams?
2. Name a book or movie you like and why.
3. Name a historical figure you like and why.
4. Why would you like to succeed at this job?
5. Name a risky thing you have done and why.
6. Explain a decision you have made under pressure and why that was your decision.
7. Hope, fear and greed are said to be enemies of good traders. Explain a decision you may have made under one of these influences and how you view that decision now.
8. What are some good qualities you have that might help in trading?
9. What are some bad qualities you have that might hurt in trading?
10. In trading would you rather be good or lucky? Why?
11. Is there anything else you’d like to add?
Master Your Setup, Master Your self. (NQoos)
- #1,772
- May 18, 2017 10:05am May 18, 2017 10:05am
- Joined Apr 2011 | Status: Cut Your Losses, Ride Your Winners. | 2,914 Posts
Attached Image

Master Your Setup, Master Your self. (NQoos)
- #1,773
- May 19, 2017 4:03am May 19, 2017 4:03am
- Joined Apr 2011 | Status: Cut Your Losses, Ride Your Winners. | 2,914 Posts
Development of Cloud-Based Automated Trading System with Machine Learning
This article is the final project submitted by the authors as a part of their coursework in Executive Programme in Algorithmic Trading (EPAT) at QuantInsti.
Authors
https://www.quantinsti.com/wp-conten...me-150x150.jpgMaxime Fages
Maximes career spanned across the strategic aspects of value and risk, with a particular focus on trading behaviors and market microstructure over the past few years. He embraced a quantitative angle in M&A, fund management or currently corporate strategy and has always been an avid open-source software user. Maxime holds an MBA from Insead and an MSc, Engineering from Ecole Nationale Superieure DArts et Metiers; he is currently Strategy Director APAC at the CME Group.
https://www.quantinsti.com/wp-conten...ek-150x150.jpgDerek Wong
Derek began his career on the floor of the CBOT then moved upstairs to focus on proprietary trading and strategy development. He manages global multi-strategy portfolios, focusing in the futures and options space. He is currently the Deputy Director of Systematic Trading at Foretrade Investment Co Ltd.
Ideation
By the end of the Executive Programme in Algorithmic Trading (EPAT) lectures, Derek and I were spending a significant amount of time exchanging views over a variety of media. We discussed ideas for a project, and the same themes were getting us excited. First, we were interested in dealing with Futures rather than cash instruments. Second, we both had a solid experience using R for quantitative research and were interested in getting our hands dirty on the execution side of things, especially on the implementation of event-driven strategies in Python (which neither of us knew before the EPAT program). Third, we had spent hours discussing and assessing the performance of Machine Learning for trading applications and were pretty eager to try our ideas out. Finally, we were very interested in practical architecture design, particularly in what was the best way to manage the variable resource needs of any Machine Learning framework (training vs. evaluating).
The scope of our project, therefore, came about naturally: developing a fully cloud-based automated trading system that would leverage on simple, fast mean-reverting or trend-following execution algorithms and call on Machine learning technology to switch between these.
Project description
The machine learning class of the EPAT programme featured the use of a Support Vector Machine and evidenced how it did slightly perform better than a GARCH model at predicting volatility. Literature suggested that Recurrent Neural Networks models could perform even better under the right circumstances [1], and that combining models (thick modeling) might mitigate over-fitting concerns [2]. That indeed was an appealing prospect, but our dabbling in using ML frameworks (mostly e1071, caret and nnet for R, and the excellent scikit-learn or the easier pybrain in Python) had shed light on a key issue: resource management. The learning phase of most models can be painfully long on a mid-range desktop computer, and the sheer size of most datasets will soak up a considerable amount of RAM. A relatively high-end PC, for example, would probably do reasonably well using GPU-optimization. However, that would bring further challenges beyond the cost: administering such a system is an art in itself, and one we had no experience in. Besides, most libraries mentioned above can be tricky to setup properly; this is particularly problematic for machine learning research, as neuron coefficients, for example, dont have salient values that can easily be sanity-checked. A model that performs poorly has enough potential root causes not to add a layer of amateur administration, especially at our scale.
Structure
https://www.quantinsti.com/wp-conten.../structure.png
https://www.quantinsti.com/wp-conten.../2016/07/2.png
https://www.quantinsti.com/wp-conten.../2016/07/3.png
# Map 1-based optional input ports to variables dataset1 <- maml.mapInputPort(1) # class: data.frame #simple polling dataset1$trend_poll <- ifelse((dataset1$trend_NN == "trend") +(dataset1$trend_TCdeep == "trend") + (dataset1$trend_boostDT == "trend") > (dataset1$trend_NN == "notrend") +(dataset1$trend_TCdeep == "notrend") + (dataset1$trend_boostDT == "notrend"), "trend", "notrend") #poll trend confindence (as in "sum of confidence if youwere right") dataset1$trend_poll_conf <- (dataset1$trend_NN == dataset1$trend_poll)*dataset1$trend_NNprob+ (dataset1$trend_TCdeep == dataset1$trend_poll)*dataset1$trend_TCdeepprob+ (dataset1$trend_boostDT == dataset1$trend_poll)*dataset1$trend_boostDTprob #simple polling as the threshold is not really helping dataset1$range_poll <- ifelse((dataset1$range_NN == "range") +(dataset1$range_TCdeep == "range") + (dataset1$range_boostDT == "range") > (dataset1$range_NN == "norange") +(dataset1$range_TCdeep == "norange") + (dataset1$range_boostDT == "norange"), "range", "norange") #poll trend confindence (as in "sum of confidence if youwere right") dataset1$range_poll_conf <- (dataset1$range_NN == dataset1$range_poll)*dataset1$range_NNprob+ (dataset1$range_TCdeep == dataset1$range_poll)*dataset1$range_TCdeepprob+ (dataset1$range_boostDT == dataset1$range_poll)*dataset1$range_boostDTprob dataset1$final <- ifelse(dataset1$trend_poll == "trend" & dataset1$range_poll == "norange", "trend", ifelse(dataset1$trend_poll == "notrend" & dataset1$range_poll == "range", "range", ifelse(dataset1$trend_poll == "trend" & dataset1$range_poll == "range", ifelse(dataset1$trend_poll_conf>dataset1$range_poll_conf,"trend","range"),"nothing"))) data.set <- as.data.frame(dataset1$final) # Select data.frame to be sent to the output Dataset port maml.mapOutputPort("data.set")
R Snippet 1: simple polling device, connected to the Azure Stack network
In some rare instances, neither side conclude to a signal, in which case we do nothing for 5 mn. The choice of this 5 mn was not entirely arbitrary, but rather an educated compromise between our view on a stable (even temporarily) trading environment and the actual definitive periods of WTI [4] ( the wavelet package was pretty useful).
https://www.quantinsti.com/wp-conten.../2016/07/5.png
https://www.quantinsti.com/wp-conten...016/07/6-7.png
R Snippet 2: Eyeball function to generate Figures 6 & 7
Trading Strategy Development
We determined three guiding principles that we maintained during our strategy development. Primarily, we needed a strategy that would significantly rely on and leverage the machine learning architecture. Secondarily, we needed the strategy to perform in such a way that the empirical analysis of performance from different regime states would allow us to judge the trading strategy itself but also see if the machine learning was performing well in real time. Finally, of course, with all trading strategies, we wanted it to be profitable.
The innate complexities of our machine learning architecture lead us to stay relatively simplistic in our trading strategy. This was essential for several reasons, simplified trading logic allowed us to avoid classic strategy development pitfalls. For instance: over fitting, limiting degrees of freedom, confounding logic errors, and data contamination. When running several different types of training and back tests, first for the machine learning architecture, then developing the trading logic itself posed twice as many opportunities to fall into the classic strategy development traps.
The trading system is based on frequentist statistical inference for our calculations. We decided to use a simple statistical measure, Z-score as the foundation of our strategy. This is an extremely simple standard statistical formula. The reason for this is because we did not want additional complexity to arise from the combination of the ML structure plus our trading logic model.
zscore = (self.last_trade - self.cur_mean)/self.cur_sd
Python Snippet 1: z-score formula snippet
Entry Trigger Process
Our entrys condition was simply based on two factors, primarily the machine learning market regime state and a Z score generated trigger condition.
Entry ConditionsAbove Z Score ThresholdBelow Z Score Threshold
Ranging Regime StateSell ShortBuy Long
Trending Regime StateBuy LongSell Short
Python Snippet 2: Trading logic trigger condition
Our reasoning for using simple symmetrical trigger logic is as follows. By maintaining the absolute simplest method for triggering, we can maximize our reliance on the machine learning. If the market regime is incorrect due to the simplistic nature of the trigger, the amount of independent alpha generated should be close to 0 or negative if you include market frictions. This is making the assumption that markets for short periods of high-frequency data are a Geometric Brownian Motion (GBM) Processes e.g. random walk.
If the machine learning can detect when that is not the case and there is some distribution where the tails are divergent from a log-normal distribution then we can generate alpha. For example, we have three regime states: trend, range, and nothing. If GBM holds true, the time series should be either in nothing or range. This is made clear by Figure 4, however, we do show a statistically significant portion of the time is spent in the trending area. Which would show that time series has variance in the kurtosis, and stochastic volatility. This leads to areas where we can generate alpha from trending strategies due to excess kurtosis. However, a standard Z-score is incapable of being able to discern these different time series regimes, and it makes the assumption of a normal distribution. Hence, the trading trigger can become profitable if and only if the machine learning architecture can accurately discern the market regime state.
This strategy also includes the same type of assumptions that are present in our machine learning two hemispheres, that in different regimes we should have two types of market price distributions. One would be more leptokurtic and lead to fatter tails, marking a trend regime. The other would be a more normal or even platykurtic with comparably thinner tails, leading to a range regime.
The Z-score would assume a normal distribution which means all of the targetable activity that we are looking to take advantage is in the tails. Therefore by using a Z-score trigger we can simply do that and only have trigger points at what we judged to be extreme values, looking to take advantage of different tail conditions. Our parameter trigger point was any Z-Score between 2 and 2.5 (Z_THRESH and Z_THRESH + Z_THRESH_UP)
Exits
Our exits are extremely simple as well, given our primary goals. We use two types of exit conditions. For range regime mean reverting trades a Z-score higher than our Z_TARGET for longs or lower for shorts was used. We expect mean reverting activity which would be a Z-score of 0 but we have it a slightly larger range to close a position of +/-0.2 in our parameters. We also have an additional 4 tick trailing stop, this was used for both systems. However for the trending trade was the only exit condition.
Parameters
Our parameter set was taken directly from the normal distribution assumption. These are controlled by a separate config file in our architecture, which makes for easy modification. We used a Z-score threshold (Z_THRESH) of 2 and limited to a 2.5 (Z_THRESH + Z_THRESH_UP). This is so we do not try to enter trades that have already diverged extremely far away. The STOP_OFFSET are in ticks for a trailing stop, and Z_TARGET is Z-score of 0.2 where we close mean reverting positions around the mean.
# trading parameters Z_THRESH = 2 Z_THRESH_UP = 0.5 STOP_OFFSET = 0.04 Z_TARGET = 0.2
Python Snippet 3: Trading logic parameters
How did the project go?
The parameters we have been using lead to a 14x-16x turn per hours (7-8 round turns). It is significant, especially if looking at the number from a nominal perspective: that is roughly 16.5MUSD nominal traded every day, on around 5KUSD of margin (the latter, however, is the only interesting parameter from on ROE perspective)
The strategy performed fairly well: 45% wins at around 1.8 ticks per contract, 29% losses at around 1.7 ticks per contract, and 26% scratch. However, the average profit, at ca. 0.32 tick per round-trip trade has to be put in perspective with the 1.42USD that IB would charge us for each trade [5]; the economics for retail traders are tough. Net, 3.2USD profit for 2.84USD brokerage and exchange fees would yield a theoretic 20%-30% monthly return on the margin posted. This might look impressive, but given the leverage involved doesnt nearly compensate for the potential loss that could arise from unforeseen, odd market conditions (spike linked to announcements, liquidity drops) and even less so for operational risks (bug or system breakage). Besides, it is not clear we could have scaled the strategy enough to make returns worth some true investments without significant slippage.
On the other hand, resource costs were ridiculously low: the AWS micro instance is free for a year, and given the heavy lifting (ML) is done at azure that was enough processing power for us, and the Azure stack comes out at under 10USD/m (seat and then 50ct for a 1,000 API calls)
Conclusion
With regards to trading, our three main conclusions are:
This article is the final project submitted by the authors as a part of their coursework in Executive Programme in Algorithmic Trading (EPAT) at QuantInsti.
Authors
https://www.quantinsti.com/wp-conten...me-150x150.jpgMaxime Fages
Maximes career spanned across the strategic aspects of value and risk, with a particular focus on trading behaviors and market microstructure over the past few years. He embraced a quantitative angle in M&A, fund management or currently corporate strategy and has always been an avid open-source software user. Maxime holds an MBA from Insead and an MSc, Engineering from Ecole Nationale Superieure DArts et Metiers; he is currently Strategy Director APAC at the CME Group.
https://www.quantinsti.com/wp-conten...ek-150x150.jpgDerek Wong
Derek began his career on the floor of the CBOT then moved upstairs to focus on proprietary trading and strategy development. He manages global multi-strategy portfolios, focusing in the futures and options space. He is currently the Deputy Director of Systematic Trading at Foretrade Investment Co Ltd.
Ideation
By the end of the Executive Programme in Algorithmic Trading (EPAT) lectures, Derek and I were spending a significant amount of time exchanging views over a variety of media. We discussed ideas for a project, and the same themes were getting us excited. First, we were interested in dealing with Futures rather than cash instruments. Second, we both had a solid experience using R for quantitative research and were interested in getting our hands dirty on the execution side of things, especially on the implementation of event-driven strategies in Python (which neither of us knew before the EPAT program). Third, we had spent hours discussing and assessing the performance of Machine Learning for trading applications and were pretty eager to try our ideas out. Finally, we were very interested in practical architecture design, particularly in what was the best way to manage the variable resource needs of any Machine Learning framework (training vs. evaluating).
The scope of our project, therefore, came about naturally: developing a fully cloud-based automated trading system that would leverage on simple, fast mean-reverting or trend-following execution algorithms and call on Machine learning technology to switch between these.
Project description
The machine learning class of the EPAT programme featured the use of a Support Vector Machine and evidenced how it did slightly perform better than a GARCH model at predicting volatility. Literature suggested that Recurrent Neural Networks models could perform even better under the right circumstances [1], and that combining models (thick modeling) might mitigate over-fitting concerns [2]. That indeed was an appealing prospect, but our dabbling in using ML frameworks (mostly e1071, caret and nnet for R, and the excellent scikit-learn or the easier pybrain in Python) had shed light on a key issue: resource management. The learning phase of most models can be painfully long on a mid-range desktop computer, and the sheer size of most datasets will soak up a considerable amount of RAM. A relatively high-end PC, for example, would probably do reasonably well using GPU-optimization. However, that would bring further challenges beyond the cost: administering such a system is an art in itself, and one we had no experience in. Besides, most libraries mentioned above can be tricky to setup properly; this is particularly problematic for machine learning research, as neuron coefficients, for example, dont have salient values that can easily be sanity-checked. A model that performs poorly has enough potential root causes not to add a layer of amateur administration, especially at our scale.
Structure
https://www.quantinsti.com/wp-conten.../structure.png
Figure 1: Technology Stack
Our architecture is relatively simple and was designed to live in remote servers. After the initiation sequence when historical market data is pulled, a timekeeper process triggers an update of mean and standard deviation [3] along with an incremental minute-data bar update. Every 5 minutes, it will trigger a call of the machine learning stack to get an assessment of the next 5 minutes. Data streamed from the broker is queued and processed by the handler to update all key trading parameters. A very simple strategy continuously assesses the signals: if the machine learning stack indicated a trending regime, it will watch for a Z-Score threshold as a starting trend, otherwise it will go for a mean-reversion trade. Signals are queued where the order execution will fetch them and naively process orders. Practically, the execution executes a limit order at the bid (long) or ask (short) and wait for an ack (ack messages are pushed in a third queue when caught from the brokers API). If an ack isnt detected within a time out parameter, the order is considered stale and either cancelled if it is an initial position order or changed to a market order if it is a profit taking or stop order. Fills inferred from acks are added to the plot.ly monitor (third-party charting of stream).https://www.quantinsti.com/wp-conten.../2016/07/2.png
Figure 2: Realtime plotly monitor, with trade execution and indicators
We will not release the full details of the machine learning model, but the general principle is that we have two hemispheres trained separately to predict ranging or trending conditions. Each hemisphere features three different models with specific parameters, and each side polls its models to decide on upcoming conditions. In the event both sides disagree (e.g. range and trend conditions detected), the stack assesses the confidence parameters of models to decide.https://www.quantinsti.com/wp-conten.../2016/07/3.png
Figure 3: Overview of the Machine Learning stack
https://www.quantinsti.com/wp-conten.../2016/07/4.png
Figure 4: Distribution of out-of-sample results
One of the very nice features about the Azure Machine Learning Studio is that it enables the development of custom functions. In our case, we developed a simple polling methodology to poll both hemispheres and, should inconsistencies occur, go with the side whose confidence was collectively highest.# Map 1-based optional input ports to variables dataset1 <- maml.mapInputPort(1) # class: data.frame #simple polling dataset1$trend_poll <- ifelse((dataset1$trend_NN == "trend") +(dataset1$trend_TCdeep == "trend") + (dataset1$trend_boostDT == "trend") > (dataset1$trend_NN == "notrend") +(dataset1$trend_TCdeep == "notrend") + (dataset1$trend_boostDT == "notrend"), "trend", "notrend") #poll trend confindence (as in "sum of confidence if youwere right") dataset1$trend_poll_conf <- (dataset1$trend_NN == dataset1$trend_poll)*dataset1$trend_NNprob+ (dataset1$trend_TCdeep == dataset1$trend_poll)*dataset1$trend_TCdeepprob+ (dataset1$trend_boostDT == dataset1$trend_poll)*dataset1$trend_boostDTprob #simple polling as the threshold is not really helping dataset1$range_poll <- ifelse((dataset1$range_NN == "range") +(dataset1$range_TCdeep == "range") + (dataset1$range_boostDT == "range") > (dataset1$range_NN == "norange") +(dataset1$range_TCdeep == "norange") + (dataset1$range_boostDT == "norange"), "range", "norange") #poll trend confindence (as in "sum of confidence if youwere right") dataset1$range_poll_conf <- (dataset1$range_NN == dataset1$range_poll)*dataset1$range_NNprob+ (dataset1$range_TCdeep == dataset1$range_poll)*dataset1$range_TCdeepprob+ (dataset1$range_boostDT == dataset1$range_poll)*dataset1$range_boostDTprob dataset1$final <- ifelse(dataset1$trend_poll == "trend" & dataset1$range_poll == "norange", "trend", ifelse(dataset1$trend_poll == "notrend" & dataset1$range_poll == "range", "range", ifelse(dataset1$trend_poll == "trend" & dataset1$range_poll == "range", ifelse(dataset1$trend_poll_conf>dataset1$range_poll_conf,"trend","range"),"nothing"))) data.set <- as.data.frame(dataset1$final) # Select data.frame to be sent to the output Dataset port maml.mapOutputPort("data.set")
R Snippet 1: simple polling device, connected to the Azure Stack network
In some rare instances, neither side conclude to a signal, in which case we do nothing for 5 mn. The choice of this 5 mn was not entirely arbitrary, but rather an educated compromise between our view on a stable (even temporarily) trading environment and the actual definitive periods of WTI [4] ( the wavelet package was pretty useful).
https://www.quantinsti.com/wp-conten.../2016/07/5.png
Figure 5: Wavelet (spectral) view of WTI prices
The out-of-sample performance was an impressive 74%, with the very important caveat that our sample was limited to 6 months 1-min bars. The R code to wrangle data is part of the github repository, and essentially converts a series on standard indicators (SMA, LMA, RSI, ATR, etc.) for the previous 5 mn into a single 50 data points (input) + 1 output. Training on the Azure framework is fast, and the brilliant interface makes it easy to add in custom code in python or R. Going from training to a live RESTful API is blissfully simple, and the response time clearly under 100ms.https://www.quantinsti.com/wp-conten...016/07/6-7.png
Figure 6: range condition input for training Figure 7: trend condition input for training
#eyeball using quantmod eyeb<-function(x){ i=x start <- index(df)[1]+i*60*5 mid <-start+5*60 end <- start+10*60 tmp <- df[index(df) >=start & index(df) < mid] tmp2 <- df[index(df) >=mid & index(df) < end] tmp3 <- df[index(df) >=start & index(df) < end] mychartTheme <- chart_theme() mychartTheme$rylab = T chart_Series(tmp3[,c("open","high","low","close")], theme=mychartTheme) slp_av <- mean(tail(tmp2$trend,3)) ln_slp <- function(x){xts(coredata(first(x)+slp_av*as.numeric((index(x)-first(index(x))))),order.by=index(x))} dummy <- (tmp2$high+tmp2$low)/2 add_TA(ln_slp(dummy),on=1, col=3) ta_up <- xts(rep(mean(tmp$close)+z_thresh*last(tmp$atr),length(index(tmp2))),order.by = index(tmp2)) add_TA(ta_up, on=1, col=4) ta_dn <- xts(rep(mean(tmp$close)-z_thresh*last(tmp$atr),length(index(tmp2))),order.by = index(tmp2)) add_TA(ta_dn, on=1, col=4) }R Snippet 2: Eyeball function to generate Figures 6 & 7
Trading Strategy Development
We determined three guiding principles that we maintained during our strategy development. Primarily, we needed a strategy that would significantly rely on and leverage the machine learning architecture. Secondarily, we needed the strategy to perform in such a way that the empirical analysis of performance from different regime states would allow us to judge the trading strategy itself but also see if the machine learning was performing well in real time. Finally, of course, with all trading strategies, we wanted it to be profitable.
The innate complexities of our machine learning architecture lead us to stay relatively simplistic in our trading strategy. This was essential for several reasons, simplified trading logic allowed us to avoid classic strategy development pitfalls. For instance: over fitting, limiting degrees of freedom, confounding logic errors, and data contamination. When running several different types of training and back tests, first for the machine learning architecture, then developing the trading logic itself posed twice as many opportunities to fall into the classic strategy development traps.
The trading system is based on frequentist statistical inference for our calculations. We decided to use a simple statistical measure, Z-score as the foundation of our strategy. This is an extremely simple standard statistical formula. The reason for this is because we did not want additional complexity to arise from the combination of the ML structure plus our trading logic model.
zscore = (self.last_trade - self.cur_mean)/self.cur_sd
Python Snippet 1: z-score formula snippet
Entry Trigger Process
Our entrys condition was simply based on two factors, primarily the machine learning market regime state and a Z score generated trigger condition.
Entry ConditionsAbove Z Score ThresholdBelow Z Score Threshold
Ranging Regime StateSell ShortBuy Long
Trending Regime StateBuy LongSell Short
Table 1: Entry condition logic matrix
if abs(zscore) >= self.zscore_thresh and \ abs(zscore) <= settings.Z_THRESH + settings.Z_THRESH_UP and \ self.trading.is_set() and \ (self.fill_dict == [] or self.fill_dict[-1]["type"] != "main") and \ self.flag != "nothing": self.exec_logger.info("signal for main detected - strategy") try: if zscore >= self.zscore_thresh: if self.flag == "trend": action = "BUY" if self.flag == "range": action = "SELL" if zscore <= -self.zscore_thresh: if self.flag == "trend": action = "SELL" if self.flag == "range": action = "BUY"Python Snippet 2: Trading logic trigger condition
Our reasoning for using simple symmetrical trigger logic is as follows. By maintaining the absolute simplest method for triggering, we can maximize our reliance on the machine learning. If the market regime is incorrect due to the simplistic nature of the trigger, the amount of independent alpha generated should be close to 0 or negative if you include market frictions. This is making the assumption that markets for short periods of high-frequency data are a Geometric Brownian Motion (GBM) Processes e.g. random walk.
If the machine learning can detect when that is not the case and there is some distribution where the tails are divergent from a log-normal distribution then we can generate alpha. For example, we have three regime states: trend, range, and nothing. If GBM holds true, the time series should be either in nothing or range. This is made clear by Figure 4, however, we do show a statistically significant portion of the time is spent in the trending area. Which would show that time series has variance in the kurtosis, and stochastic volatility. This leads to areas where we can generate alpha from trending strategies due to excess kurtosis. However, a standard Z-score is incapable of being able to discern these different time series regimes, and it makes the assumption of a normal distribution. Hence, the trading trigger can become profitable if and only if the machine learning architecture can accurately discern the market regime state.
This strategy also includes the same type of assumptions that are present in our machine learning two hemispheres, that in different regimes we should have two types of market price distributions. One would be more leptokurtic and lead to fatter tails, marking a trend regime. The other would be a more normal or even platykurtic with comparably thinner tails, leading to a range regime.
The Z-score would assume a normal distribution which means all of the targetable activity that we are looking to take advantage is in the tails. Therefore by using a Z-score trigger we can simply do that and only have trigger points at what we judged to be extreme values, looking to take advantage of different tail conditions. Our parameter trigger point was any Z-Score between 2 and 2.5 (Z_THRESH and Z_THRESH + Z_THRESH_UP)
Exits
Our exits are extremely simple as well, given our primary goals. We use two types of exit conditions. For range regime mean reverting trades a Z-score higher than our Z_TARGET for longs or lower for shorts was used. We expect mean reverting activity which would be a Z-score of 0 but we have it a slightly larger range to close a position of +/-0.2 in our parameters. We also have an additional 4 tick trailing stop, this was used for both systems. However for the trending trade was the only exit condition.
Parameters
Our parameter set was taken directly from the normal distribution assumption. These are controlled by a separate config file in our architecture, which makes for easy modification. We used a Z-score threshold (Z_THRESH) of 2 and limited to a 2.5 (Z_THRESH + Z_THRESH_UP). This is so we do not try to enter trades that have already diverged extremely far away. The STOP_OFFSET are in ticks for a trailing stop, and Z_TARGET is Z-score of 0.2 where we close mean reverting positions around the mean.
# trading parameters Z_THRESH = 2 Z_THRESH_UP = 0.5 STOP_OFFSET = 0.04 Z_TARGET = 0.2
Python Snippet 3: Trading logic parameters
How did the project go?
The parameters we have been using lead to a 14x-16x turn per hours (7-8 round turns). It is significant, especially if looking at the number from a nominal perspective: that is roughly 16.5MUSD nominal traded every day, on around 5KUSD of margin (the latter, however, is the only interesting parameter from on ROE perspective)
The strategy performed fairly well: 45% wins at around 1.8 ticks per contract, 29% losses at around 1.7 ticks per contract, and 26% scratch. However, the average profit, at ca. 0.32 tick per round-trip trade has to be put in perspective with the 1.42USD that IB would charge us for each trade [5]; the economics for retail traders are tough. Net, 3.2USD profit for 2.84USD brokerage and exchange fees would yield a theoretic 20%-30% monthly return on the margin posted. This might look impressive, but given the leverage involved doesnt nearly compensate for the potential loss that could arise from unforeseen, odd market conditions (spike linked to announcements, liquidity drops) and even less so for operational risks (bug or system breakage). Besides, it is not clear we could have scaled the strategy enough to make returns worth some true investments without significant slippage.
On the other hand, resource costs were ridiculously low: the AWS micro instance is free for a year, and given the heavy lifting (ML) is done at azure that was enough processing power for us, and the Azure stack comes out at under 10USD/m (seat and then 50ct for a 1,000 API calls)
Conclusion
With regards to trading, our three main conclusions are:
- Software as a service for machine learning makes absolute sense whenever possible. Response time at 50ms-100ms is a clear limit, but the incremental investment and operational risk to go under that mark is very significant. For any longer horizon application, the technology, and Microsofts Azure ML Studio in particular is worth exploring.
- It is still possible to make money on automated trading with limited resources, even on outrights. However, exchanges/brokerage fees can quickly erode or even cancel profits. Incentive/Tiered program are of paramount importance for such strategies to be profitable. And yes, this is stating the obvious, but we now have a first-hand experience.
- Between the obvious research and coding part, engineering abstract concepts into actionable objects and code is probably more art than science. There is a clear premium to having actual experience (and failures) under ones belt in that area.
Recommendations to future students/coders:
- Explore libraries, and get a thorough understanding of what they can/will do. IBPY, for example, has the merit of simply existing. Documentation is almost inexistent, but it does have a very large number of wrappers calling all API functionalities. Chances are we ended up re-writing some functionalities that existed (and when we did, our implementation is very likely to be worst)
- A game of chess is like a swordfight, you must think first before you move Wu-Tang Clan. This ancient wisdom definitely also applies to development, especially for when classes and concurrency are involved. Since we had no experience of such development or designing software architecture, we started by hacking through James Ma High Frequency project. Its safe to say almost nothing remains from James excellent work in our project; working around limitations induced by the scope differences always eventually ended in blocks, and refactoring. In the end, we would have saved a lot of time thinking longer about conceptual blocks and then working toward them from the ground up (with the caveat that at the time we had no idea how to do that, and James work was a good bootstrap). Ironically, our eventual architecture looks very much like the one in Quantinstis System Architecture 101.
- Most of our R/Python at work involves sequential workflow, developed iteratively. Trading systems involve data being streamed from the exchanges, orders being pushed based on signals, acknowledgements or orders, etc. In hindsight, this, of course screams threads and concurrency, but James had (very well) managed to keep his work sequential and relying on classes alone. This did not work for us, and compounded with the aforementioned issue led to the first refactoring (unsuccessfully, since we had bet on the wrong library for the job: threading). We would very much encourage anyone looking into python for trading to dig into asyncio if ones using python 3.5 or concurrent.Futures which is backported for 2.7 as well (we used the later). Now, multiprocessing has its own frustrating challenges: thread dying in silence, (not) thread-safe objects, etc. and is generally a very different design paradigm. On the plus side, it is incredibly gratifying when it does work
- Quality Assurance is probably the least sexy aspect of development. It is also the one we have, and will, invest a lot of learning/reading time in. This is not a skill that is as critical in a notebook-type environment because debugging can be performed on the go for the most part, one step at a time. Of course, when multiple threads interact with data from various sources, this is a very different situation. Writing print statements everywhere wont cut it, and both logging and traceback are libraries very much worth investing time in. To be fair, none are particularly intuitive (nor is the Exception class use, by the way) but systematic try/except and logging points truly is a lifesaver
- The old feel the pain now or feel the pain later moniker is particularly apt when it comes to development. Using class and other less-than-intuitive taxonomy of object and process is a double-edged sword. Most classes and functions will not be straight forward to test, and attempting to test basic functionalities (proper typing of output, e.g.) in an integrated test is a recipe for disaster. We ended up using the very nice __main__ python semantic to scaffold individual classes with basics required to run, as a poor mans unitest (another un-sexy library that is really critical). In the end, the time required to develop testing features is not insignificant (we assume it could have been around 20%) but it is a very good use of resource. A good example is that we did not build a market simulator. That was a decision we had made based on the limited interest we had actually trading much with IB (due in large part to contractual restrictions) and, quite frankly, on the skills we had at the beginning. This was a really bad decision from a time perspective alone: the boot sequence to register on IB is roughly 20 seconds long. Accounting for a signal to happen, this is probably 30 seconds minimum which in a 4-hours development sequence might require 20 to 30 reboots. Conservatively, 10-20 minutes of wasted time or 5%-10% or productivity loss. That is before even being able to test specific situations rather than waiting for one to happen, and there is no doubt in our mind that even biting the bullet mid-way would still have been largely beneficial (including for parameters adjustment).
Broadly speaking, this was the key takeaway: getting a project 80% done is the easy and fun part. The hard and tedious one is the last 20%, and that is also where actual skills matter (especially in quality assurance).
We gained a lot in the process and would like to thank the faculty for their help and guidance. We do not plan to maintain the public release of the program given our respective contractual limitations but plan on working together again in the near-term.
Github Repository: https://github.com/FaGuoMa/Azure-IB/.
Attached Image (click to enlarge)

Master Your Setup, Master Your self. (NQoos)
1
- #1,774
- May 19, 2017 4:34am May 19, 2017 4:34am
- Joined Apr 2011 | Status: Cut Your Losses, Ride Your Winners. | 2,914 Posts
Deep Learning And Machine Learning Simply Explained
In a recent article, we demystified some of the technical jargon that’s being thrown around these days like “artificial intelligence”, “SaaS, “the cloud”, and “deep learning”. While the techies can debate among themselves the difference between “machine learning” and “deep learning”, we’re going to consider the two terms synonymous and henceforth just talk about “deep learning”. So just what is “deep learning”? We wanted to understand more, so we came across this excellent TED talk given by Jeremy Howard which finally explains in layman’s terms just what deep learning is. If you have 20 minutes, watch the video now and no need to read any further. If you don’t have time to watch the video, here’s what we learned.
When you use Google Images to search for a “grey cat”, Google Images shows you grey cats. Is this because Google can recognize what a grey cat looks like? No. This is simply because Google searches text to find grey cat images. So how can we train Google to identify grey cats by only looking at images? Here’s how we do it.
Let’s start with a sample of 10 million random pictures from Facebook and teach Google how to learn. The first part entails scanning this massive set of pictures using an algorithm developed by a software developer at Google. What does this algorithm do? It looks at the relationships of pixels in a digital photo and tries to find objects of a similar shape. Let’s try this with a simple example.
Let’s say the pictures were black and white and composed of circles, triangles and squares. You could quite easily imagine an algorithm that could first identify the differences in color (every color is actually a unique code in software) and then start to map sharp differences in color that would denote shapes. The shapes could then be described by the direction of the lines as either circles, triangles, or squares. You could even go ahead and make them color pictures. The computer can now point out a “red triangle” or even a “beige circle”. Without even having to do much coding, the computer now has the intelligence of a small child when it comes to identifying shapes.
Now let’s take this to the next level. Let’s take a sophisticated deep learning algorithm and feed it 100 million pictures from Facebook. Let’s tell the algorithm to try and find similar objects in this “big data” set and then group them. These groups are displayed to a developer who can then label them. Humans would perhaps be the most obvious and frequent object that the computer would identify. The developer would then be shown 50 humans the computer identified and could start to label sets within the group like “old person”, “baby, “Chinese person” or “freckled person”.
After many many iterations, the algorithm then starts to recognize patterns in the mistakes that it makes. It can now recognize the difference between a young person with their hair dyed grey, and an old person with grey hair. It knows that because a developer pointed out a facial feature called “wrinkles”, and the algorithm now associates wrinkles with an old person.
Once the algorithm has learned sufficiently from all that “big data”, it can then be fed pictures which it can label through visual identification as seen in the below example:
http://www.nanalyze.com/app/uploads/...ng_Example.jpg
If you’re still reading this, it probably means you didn’t watch the TED talk so there are a few more takeaways you should know. “Deep learning” is expected to take over 80% of service jobs globally. That’s not a typo. “Deep learning” is expected to be so disruptive that 80% of service jobs will be replaced by deep learning machines. Here’s perhaps the most compelling proof of how powerful “deep learning” is. It’s industry agnostic, meaning that deep learning developers don’t have to know anything about the industry they are evaluating. The author of that TED talk, Jeremy Howard, has started a company which can detect malignant lung nodules in X-ray scans 50% better than humans with the developers having no medical background at all. How incredible is that?
Master Your Setup, Master Your self. (NQoos)
1
- #1,775
- May 19, 2017 5:03am May 19, 2017 5:03am
- Joined Apr 2011 | Status: Cut Your Losses, Ride Your Winners. | 2,914 Posts
Attached Image

Master Your Setup, Master Your self. (NQoos)
- #1,776
- May 26, 2017 5:23am May 26, 2017 5:23am
- Joined Apr 2011 | Status: Cut Your Losses, Ride Your Winners. | 2,914 Posts
Back to Basics Part 2 – How to Succeed at Algorithmic Trading
Posted on March 20, 2017 by Kris Longmore
There is a lot of information about algorithmic and quantitative trading in the public domain today. The type of person who is attracted to the field naturally wants to synthesize as much of this information as possible when they are starting out. As a result, newcomers can easily be overwhelmed with “analysis paralysis” and wind up spending a lot of their valuable spare time working on algorithmic trading without making much meaningful progress. This article aims to address that by sharing the way in which I would approach algorithmic trading as a beginner if I were just starting out now, but with the benefit of many years of hindsight.
This article is somewhat tinged with personal experience, so please read it with the understanding that I am describing what works for me. I don’t claim to be a guru on personal or professional development, but I did manage to independently develop my algorithmic trading skills to the point where I was able to leave my day job for a career in the markets – so maybe I have some personal experiences and insight that might be beneficial.
Part 1 of this Back to Basics series provided some insight into two of the most fundamental questions around algorithmic trading:
- What is it?
- Why should I care?
If you’re new to algorithmic trading, I hope Part 1 whet your appetite for finding out more and maybe even convinced you that algorithmic trading is a sensible approach to the markets. In this post, we will go a little further and investigate the things that people who are just starting out should think about. In particular, I aim to provide you with something of a roadmap for getting started and making progress as efficiently as possible, whatever your goals might be, by sharing some of the practical things that I’ve learned along the way. The article will cover:
- What to learn in order to succeed
- How to learn it
- Important practical considerations
Note on terminology
The term “algorithmic trading” is sometimes used in professional settings to refer to execution algorithms, for example algorithms that split up a large order to optimize the total cost of the transaction. In this post, I generally use the terms systematic, algorithmic and quantitative trading interchangeably to refer to strategic trading algorithms that look to profit from market anomalies, deviation from fair value, or some other statistically verifiable opportunity.
What to do in order to succeed
Active doing is so much more important than passive learning.
Learning the theoretical underpinnings is important – so start reading – but it is only the first step. To become proficient at algorithmic trading, you absolutely must put the theory into practice. This is a theme that you will see repeated throughout this article; emphasizing the practical is my strongest message when it comes to succeeding in this field.
Having said that, in order to succeed in algorithmic trading, one typically needs to have knowledge and skills that span a number of disciplines. This includes both technical and soft skills. Individuals looking to set up their own algorithmic trading business will need to be across many if not all of the topics described below; while if you are looking to build or be a part of a team, you may not need to be personally across all of these, so long as they are covered by other team members. These skills are discussed in some detail below.
Technical skills
The technical skills that are needed for long-term successful algorithmic trading include, as a minimum:
- Programming
- Statistics
- Risk management
There are other skills I would really like to add to this list, but which go a little beyond what I would call “minimum requirements.” I’ll touch on these later. But first, let’s delve into each of these three core skills.
1. Programming
If you can’t already program, start learning now. To do any serious algorithmic trading, you absolutely must be able to program, as it is this skill that enables efficient research. It pays to become familiar with the syntax of a C-based language like C++ or Java (the latter being much simpler to learn), but to also focus on the fundamentals of data structures and algorithms at the same time. This will give you a very solid foundation, and while it can take a decade or longer to become an expert in C++, I believe that most people can reach a decent level with six months of hard work. This sets you up for what follows.
It also pays to know at least one of the higher-level languages, like Python, R or MATLAB, as you will likely wind up doing the vast majority of your research and development in one of these languages. My personal preferences are R and Python.
- Python is fairly easy to learn and is fantastic for efficiently getting, processing and managing data from various sources. There are some very useful libraries written by generous and intelligent folks that make data analysis relatively painless, and I find myself using Python more and more as a research tool.
- I also really like using R for research and analytics as it is underpinned by a huge repository of useful libraries and functions. It was written with statistical analysis in mind, so it is a natural fit for the sort of work that algorithmic traders will need to do. The syntax of R can be a little strange though, and to this day I find myself almost constantly on Stack Overflow when developing in R!
- Finally, I have also used MATLAB and its open source counterpart Octave, but I would almost never choose to use these languages for serious algo research. That’s more of a personal preference, and some folks will prefer MATLAB, particularly those who come from an engineering background as they may have been exposed to it during their work and studies.
When you’re starting out, I don’t believe it matters greatly which of these high-level languages you choose. As time goes on, you will start to learn which tool is the most applicable for the task at hand, but there is a lot of cross-over in the capabilities of these languages so don’t get too hung up on your initial choice – just make a choice and get started!
Simulation environments
Of course, the point of being able to program in this context is to enable the testing and implementation of algorithmic trading systems. It can therefore be of tremendous benefit to have a quality simulation environment at your disposal. As with any modelling task, accuracy, speed and flexibility are significant considerations. You can always write your own simulation environment, and sometimes that will be the most sensible thing to do, but often you can leverage the tools that others have built for the task. This has the distinct advantage that it enables you to focus on doing actual research and development that relates directly to a trading strategy, rather than spending a lot of time building the simulation environment itself. The downside is that sometimes you don’t quite know exactly what is going on under the hood, and there are times when using someone else’s tool will prevent you from pursuing a certain idea, depending on the limitations of the tool.
A good simulation tool should have the following characteristics:
- Accuracy – the simulation of any real-world phenomenon inevitably suffers from a deficiency in accuracy. The trick is to ensure that the model is accurate enough for the task at hand. As statistician George Box once said, “all models are wrong, but some are useful.” Playing with useless models is a waste of time.
- Flexibility – ideally your simulation tool would not limit you or lock you in to certain approaches.
- Speed – at times, speed can become a real issue, for example when performing tick-based simulations or running optimization routines.
- Active development – if unexpected issues arise, you need access to the source code or to people who are responsible for it. If the tool is being actively developed, you can be reasonably sure that help will be available if you need it.
There are a number of options, but for the beginner there is probably none better than the Zorro platform, which combines accuracy, flexibility and speed with an extremely simple C-based scripting language that makes an ideal introduction to programming. The platform is being constantly refined and updated, with improvements being released roughly quarterly. Zorro may not look like much, but it packs a lot of power into its austere interface and is an excellent choice for beginners. I’ve also personally seen Zorro used as a research and execution tool in more than one professional trading setting. Fundamentals of Algorithmic Trading makes heavy use of the Zorro platform and includes detailed tutorials on getting started, aimed at the beginner.
2. Statistics
It would be extremely difficult to be a successful algorithmic trader without a good working knowledge of statistics. Statistics underpins almost everything we do, from managing risk to measuring performance and making decisions about allocating to particular strategies. Importantly, you will also find that statistics will be the inspiration for many of your ideas for trading algorithms. Here are some specific examples of using statistics in algorithmic trading to illustrate just how vital this skill is:
- Statistical tests can provide insight into what sort of underlying process describes a market at a particular time. This can then generate ideas for how best to trade that market.
- Correlation of portfolio components can be used to manage risk (see important notes about this in the Risk Management section below).
- Regression analysis can help you test ideas relating to the various factors that may influence a market.
- Statistics can provide insight into whether a particular approach is outperforming due to taking on higher risk, or if it exploits a genuine source of alpha.
Aside from these, the most important application of statistics in algorithmic trading relates to the interpretation of backtest and simulation results. There are some significant pitfalls – like data dredging or “p-hacking” (Head et.al. (2015)) – that arise naturally as a result of the strategy development process and which aren’t obvious unless you understand the statistics of hypothesis testing and sequential comparison. Improperly accounting for these biases can be disastrous in a trading context.
While this issue is incredibly important, it is far from obvious and it represents the most significant and common barrier to success that I have encountered since I started working with individual traders. Please, spend some time understanding this fundamentally important issue; I can’t emphasize enough how essential it is.
It also turns out that the human brain is woefully inadequate when it comes to performing sound statistical reasoning on the fly. Daniel Kahneman’s Thinking, Fast and Slow (2013) summarises several decades of research into the cognitive biases with which humans are saddled. Kahneman finds that we tend to place far too much confidence in our own skills and judgements, that human reason systematically engages in fallacy and errors in judgement, and that we overwhelmingly tend to attribute too much meaning to chance. A significant implication of Kahneman’s work is that when it comes to drawing conclusions about a complex system with significant amounts of randomness, we are almost guaranteed to make poor decisions without a sound statistical framework. We simply can’t rely on our own interpretation.
As an aside, Kahneman’s Thinking, Fast and Slow is not a book about trading, but it probably assisted me with my trading more than any other book I’ve read. I highly recommend it. Further, it is no coincidence that Kahneman’s work essentially created the field of behavioural economics.
3. Risk Management
There are numerous risks that need to be managed as part of an algorithmic trading business. For example, there is infrastructure risk (the risk that your server goes down or suffers a power outage, dropped connection or any other interference) and counter-party risk (the risk that the counter-party of a trade can’t make good on a transaction, or the risk that your broker goes bankrupt and takes your trading account with them). While these risks are certainly very real and must be considered, in this section I more concerned with risk management at the trade and portfolio level. This sort of risk management attempts to quantify the risk of loss and determine the optimal allocation approach for a strategy or portfolio of strategies. This is a complex area and there are several approaches and issues of which the practitioner should be aware.
Two (related) allocation strategies that are worth learning about are Kelly allocation and Mean-Variance Optimization (MVO). These have been used in practice, but they carry some questionable assumptions and practical implementation issues. It is these assumptions that the newcomer to algorithmic trading should concern themselves with.
Probably the best place to learn about Kelly allocation is in Ralph Vince’s The Handbook of Portfolio Mathematics, although there are countless blog posts and online articles about Kelly allocation that will be easier to digest. One of the tricky things about implementing Kelly is that it requires regular rebalancing of a portfolio that leads to buying into wins and selling into losses – something that is easier said than done.
MVO, for which Harry Markowitz won a Nobel prize, involves forming a portfolio that lies on the so-called “efficient frontier” and hence minimizes the variance (risk) for a given return, or conversely maximizes the return for a given risk. MVO suffers from the classic problem that new algorithmic traders will continually encounter in their journey: the optimal portfolio is formed with the benefit of hindsight, and there is no guarantee that the past optimal portfolio will continue to be optimal into the future. The underlying returns, correlations and covariance of portfolio components are not stationary and constantly change in often unpredictable ways. MVO therefore does have its detractors, and it is definitely worth understanding the positions of these detractors (see for example Michaud (1989), DeMiguel (2007) and Ang (2014)). A more positive exposition of MVO, governed by the momentum phenomenon and applied to long-only equities portfolios, is given in the interesting paper by Keller et.al. (2015).
Another way to estimate the risk associated with a strategy is to use Value-at-Risk (VaR), which provides an analytical estimate of the maximum size of a loss from a trading strategy or a portfolio over a given time horizon and under a given confidence level. For example, a VaR of $100,000 at the 95% confidence level for a time horizon of one week means that there is a 95% chance of losing no more than $100,000 over the following week. Alternatively, this VaR could be interpreted as there being a 5% chance of losing at least $100,000 over the following week.
As with the other risk management tools mentioned here, it is important to understand the assumptions that VaR relies upon. Firstly, VaR does not consider the risk associated with the occurrence of extreme events. However, it is often precisely these events that we wish to understand. It also relies on point estimates of correlations and volatilities of strategy components, which of course constantly change. Finally, it assumes returns are normally distributed, which is usually not the case.
Finally, I want to mention an empirical approach to measuring the risk associated with a trading strategy: System Parameter Permutation, or SPP (Walton (2014)). This approach attempts to provide an unbiased estimate of strategy performance at any confidence level at any time horizon of interest. By “unbiased” I mean that the estimate is not subject to data mining biases or “p-hacking” mentioned above. I personally think that this approach has great practical value, but it can be computationally expensive to implement and may not be suitable for all trading strategies.
So now you know about a few different tools to help you manage risk. I won’t recommend one approach over another, but I will recommend learning about each, particularly their advantages, disadvantages and assumptions. You will then be in a good position to choose an approach that fits your goals and that you understand deeply enough to set realistic expectations around. Bear in mind also that there may be many different constraints under which portfolios and strategies need to be managed, particularly in an institutional setting.
One final word on risk management: when measuring any metric related to a trading system, consider that it is not static – rather, it nearly always evolves dynamically with time. Therefore, a point measurement tells only a tiny fraction of the true story. An example of why this is important can be seen in a portfolio of equities whose risk is managed by measuring the correlations and covariance of the different components. Such a portfolio aims to reduce risk through diversification. However, such a portfolio runs into problems when markets tank: under these conditions, previously uncorrelated assets tend to become much more correlated, nullifying the diversification effect precisely when it is needed most!
Taking it Further
To the three core skills I described above, I would also like to add numerical optimization, machine learning and big data analysis as I think they are incredibly important, however they go a little beyond what I would call “minimum requirements”. These skills are nice to have in your toolkit and will make your life as an algorithmic trader easier, but unlike the other skills I described, they are not absolutely critical.
For the adventurous and truly dedicated, I can also recommend learning about behavioural finance, market microstructure and macroeconomics. Again, these are not minimum requirements, but will provide insights that can augment one’s ability to navigate the markets.
Finance and economics helps with generating trading ideas, but you don’t need formal education in these areas. In fact, I know several folks who are responsible for the hiring and firing that goes on in the professional trading space, and some of these people actually shy away from finance and economics graduates. If you hold such a degree, don’t despair though – just recognise that there is more to the practicalities of trading successfully than what you learned in your formal education.
Finally, it would be remiss of me not to mention the soft (that is, non-technical) skills that come in handy. Singularly most important of these is a critical mindset. You will read mountains of information about the markets through your algorithmic trading journey, and every page should be read with a critical eye. Get into the habit of testing ideas yourself and gathering your own evidence rather than relying on other people’s claims.
Other soft skills that are worth cultivating include perseverance in the face of rejection (you will unfortunately be forced to reject the majority of your trading ideas) and the ability to conduct high-quality, reproducible and objective research.
Your shortest path to proficiency
Overview
This section describes what I think is the best approach to acquiring as efficiently as possible the skills I listed above. You will notice that I repeatedly emphasize the practical application of the theory that underpins the skills. I very much advocate reading widely and voluminously, but it is critical that you practice implementing the things you read in order to really internalize the skills.
Learning these skills is a process. No one wakes up one day and finds that they are an excellent programmer or an expert in statistics. Like the acquisition of any skill, it takes time and of course effort. My advice is to accept that your skills will gradually improve with time, and that the best way to learn is by doing. While it is a good idea to study these topics through formal or structured channels, it is critical that you put them into practice as you go along. Try to tackle problems that are just slightly out of your comfort zone and practice applying what you learn to the markets. Such an approach will see the pace of your learning go exponential.
Further, set realistic expectations around the pace of your learning. There is no point down-playing it: the journey is indeed a long one. If you are a beginner, expect to spend at least a couple of years working hard before you see much success.
The approach I would take, if I were starting out again
When I was starting out with algorithmic trading, I read everything I could get my hands on that related to the markets. I literally read nothing but books and articles that related in some way to the markets for the first three years of my journey. I think this is important – if you want to become proficient at this, you really need to live and breathe it, at least until you gain enough skills to start making some money.
This immersive approach is imperative, but I did make some mistakes. For starters, I didn’t start implementing the things I was reading about or doing my own investigations and verifications for some time. I was content to just read. In hindsight, I now realize that this was a well-intentioned, but somewhat lazy approach that didn’t really push me too far outside of my comfort zone. If there was something I didn’t understand deeply enough to internalize, I could just keep reading. No harm done, right?
I now realize that had I insisted on taking the hard path and putting the things I read about into practice, I would have literally shaved years off the journey to proficiency and ultimately the success I was craving. By implementing the ideas you read about, you will not only gain the technical skills you need to succeed much more quickly, but you will also develop the mindset of critical thinking and creativity that drives success in this field. If you can find a mentor or a community to give you feedback on your work or to guide you when you are stuck, your progress will go even faster.
I can’t emphasize enough just how crucial this idea of doing is. No one ever found success without doing the hard things and being willing to fail. Failure is not a bad thing: it does not mean defeat until you make the decision to stop trying. Doing and risking failure is what brings proficiency and eventually mastery.
I also learned that the time you spend practicing needs to be high quality; it is about so much more than just putting in the time. You can ensure your practice is of a high quality by engaging in what others have referred to as deliberate practice. This sort of practice is hard, uncomfortable and tiring. On the other end of the spectrum, reading is passive and not overly draining, but you generally don’t get the rewards if you leave it at that. Deliberate practice requires an attitude that demands that you constantly challenge yourself. You need to continually set yourself problems that are just slightly out of your reach or beyond your current level of skill.
When you decide to learn a particular skill, divide it into sub-tasks and then master each one individually and systematically. For example, say you want to learn Python programming. You might divide this into smaller learning tasks that consist of, say, syntax familiarity, data types, variables/expressions/statements, loops, functions, conditionals, input/output, debugging and object oriented programming. Each one of these sub-tasks would be divided into smaller tasks. Such an approach forces you to incrementally improve by ticking off one sub-task after another. It has the nice by-product of being quite motivating to be able to measure your progress in terms of the sub-tasks you’ve completed.
Deliberate practice forces you to avoid relying on crutches or limiting yourself to researching ideas that are within your current skillset. However, as I mentioned previously, it is uncomfortable, and we have an unfortunate natural tendency to gravitate towards things that we find easy. This can be incredibly limiting and you must think bigger if you want to succeed. If you find yourself shying away from something, chances are it’s because it is difficult for you. This is a strong indication that you should tackle it head on!
A personal example:
Several years ago, I was learning to use a C-based language for trading research, and I shied away from anything that required significant amounts of string manipulation, like text parsing and web scraping (I now know that C isn’t the best tool for these tasks, but that’s another story). This limited my trading research to data that I was able to obtain in a relatively clean format. However, after a while I just bit the bullet and forced myself to learn. Now, having become quite accomplished at those skills in more than one programming language, I have access to exponentially more and varied data to use in my research than I had before, which has in turn provided significant inspiration for new strategies.
The lesson is that if something is challenging or uncomfortable, tackle it head-on! While easy to say, this is hard to do because it is very difficult to force ourselves to do things we find uncomfortable, especially when there are more comfortable alternatives (maybe I’ll just test another variation of that futures breakout model). So how do we deal with being uncomfortable? It’s easy to say “just tackle it head on”, but how does one do this in real life, on a consistent, day-to-day basis?
The best and only advice I can give in this regard is to forget about motivation altogether. Yes, you read that correctly. Motivation doesn’t work. Think about it: motivation is an incredibly fickle beast, waxing and waning on a daily or even hourly basis. Motivation can be sapped by things as common as being tired or hungry! How then can it be relied upon to deliver something as important as your life goals? My experience tells me that if you rely on your motivation, you are almost guaranteeing your own failure.
So if motivation isn’t the answer, what is? The answer is simple: discipline. You must develop the discipline to put in the hours doing the difficult things.
OK, this sounds like another one of those “easy to say, hard to do” things, right? How do you actually put that into practice? Well, it can be difficult to develop a strong internal discipline that you can consistently rely upon, but there are things you can do to set yourself up for success. Some mechanisms and systems that have worked for me over the years include:
- Seeking accountability. For example, tell the people who are close to you what you are going to achieve and by when. Making your objectives public and giving them a deadline makes you that much more likely to follow through.
- Taking a systematic approach. As mentioned above, break down a goal into sub-tasks and tick them off one by one. Keep a record of your progress and review it at least weekly. Documenting what you’re learning and researching also helps with this systematic approach. Keep track of the research you do, but also make notes of things you’ve learned or things you don’t understand.
- Forming habits. Try to build habits that are easy to make part of your routine. For example, when I was learning to write code, I would code every morning for one hour before having breakfast. I simply wouldn’t eat until I’d spent an hour writing and debugging code. By tying the habit to something that was already part of my day (breakfast), it was so much easier for the habit to stick. You don’t need to do exactly what I did, but find something that works with your lifestyle.
- Being brutally honest with oneself. For example, don’t surf the internet for 45 minutes, then code for 15 minutes and tell yourself you did an hour of work.
- Surrounding oneself with the right people. Joining and participating in a community of likeminded people certainly helps keep one focused. Telling these people your goals will also help keep you accountable. Having a community (and ideally a mentor) essentially creates a positive feedback loop that helps you identify exactly where your areas of weakness lie, which can drastically reduce the amount of time it takes to get really good at something. Watch what others who are more proficient or successful do and emulate them. Once you can do what they do, put your own twist on things and make them your own.
- Reward yourself. Celebrate little wins and value the progress you make.
If constantly pushing yourself into uncomfortable places sounds daunting or even awful, remember that if you can do this, you will put yourself at a distinct advantage over 99% of people, regardless of how intelligent or otherwise you may be. The consistent application of a disciplined approach trumps intelligence and natural talent every single day of the week. I don’t know about you, but I find that incredibly comforting and empowering! I can tell you that the essential reason that I was able to leave my day job for a career in finance, the one thing that it all boils down to, is that I was and am willing to do the things that most people aren’t. For example, I would get up early and put in a couple of hours before going to work. I would forego events that I would really have liked to attend in order to work evenings and nights.
I’ve lost count of the number of weekends I’ve given up over the last decade. If you want to achieve something extraordinary, you simply can’t do what everyone else does. That is reality.
Important Practical Matters
Finally, I want to cover some of the practical considerations that I think are important to be aware of when starting out.
Expectations
When you are learning algorithmic trading, you will find that it can be an emotional experience. This will pass as your experience and proficiency develops, but during the early years, your emotional state may become somewhat tied to your success or otherwise in the markets. This can obstruct progress, so it is worth understanding and addressing this issue.
In life, our happiness is often tied up with our expectations. Therefore, it makes sense to set ambitious yet realistic expectations for your algorithmic trading journey right at the outset. Your mental state will thank you for it.
First of all, this is a cliché, but one that rings true: trading is the hardest way to make easy money. Don’t expect an easy ride or fast riches. Rather, expect at least a couple of years of unrewarded effort and slow riches, if any riches at all.
Related to this, don’t expect to make multiples of your money in short periods of time. However, once proficient, you should expect to outperform the market over the long term (potentially significantly). Otherwise, what’s the point of doing this at all? If you look through the Barron’s list of top 100 hedge funds from last year, you’ll see that the best performing funds have a 3-year compounded annual return of just under 30%. Do you think it is reasonable that you could out-perform these top-performing funds, with their quant teams and enormous financial resources? That was kind of a loaded question, because perhaps surprisingly, the answer is yes! Funds with billions under management face completely different constraints than a do-it-yourself trader, the most interesting of these being related to capacity. For example, an individual trading say a half-million-dollar futures account can take a completely different approach to a fund that aims to generate returns on billions. There may exist market phenomena that can generate returns that are significant compared to the position sizing of a retail account, but which are not capable of carrying the trades of a larger fund. Therefore, while on the surface, it may appear that a retailer is at a significant disadvantage, there are also opportunities.
One last comment about expectations: avoid becoming fixated on how much you can make. The amount of reward you can gain is inextricably tangled up with the amount of risk you are willing to take. Thinking about reward in terms of risk rather than in isolation will lead you to much more sensible expectations.
We need to talk about frequency
The frequency at which a strategy trades is another significant consideration. Lower frequency systems might hold trades for days to months. Intra-day systems might hold trades for minutes to hours. High frequency trading generally refers to systems with holding periods on the order of milliseconds to seconds.
Trade frequency (or holding period) is an important consideration due to the effect of transaction costs. As the average holding period decreases, the average price change between the trade entry and exit also decreases. That is, the average profit potential of individual trades decreases. However, transaction costs don’t decrease, in fact they remain constant. A trade that was held for ten seconds has the same cost as a trade that was held for ten hours (assuming no swap), but their profit potentials are likely to be quite different.
The costs of trading are dependent on your broker, and to an extent your infrastructure, and will vary depending on individual set ups. Therefore, I can’t prescribe a cut-off holding period, but I will recommend that you understand the impact of trading costs across various time horizons in order to make sensible decisions. I have certainly noticed an obsession with “trading off the five-minute chart” amongst a number of retail traders that I’ve worked with, and while I do understand the lure and the excitement of such a trading style, one should really understand its viability before spending a lot of time on it.
Trading at high frequencies typically requires low-latency execution systems, server co-location and detailed knowledge of order book dynamics. This is not impossible for independent traders, but there is other lower hanging fruit that is much more accessible.
My advice for beginners with regards to trade frequency: start slow! Investigate systems with holding periods on the order of days, weeks or even months. The odds are not quite as severely stacked against you. You are much more likely to find a decent strategy if you take this approach, even as a relative beginner. By the time you’ve got one or two systems in your portfolio, you will have learned a lot and be in a much stronger position to consider higher frequency trading. Again, this is what I would do if I were starting over.
What to read and when
Hopefully you got some of your maths, statistics, and/or programming knowledge via your formal education. In my experience with graduates from various fields, Computer Science, Physics, Mathematics, Engineering, and Econometrics degrees are quite useful in terms of the background knowledge they afford. Finance and economics degrees are (maybe surprisingly) less so. Regardless of your formal education, there will almost certainly be gaps in your knowledge, so even if you don’t have formal education in one of the fields I mentioned, don’t despair, simply start learning now.
What to read and in what order really depends on what your background is. Therefore, I can’t prescribe a recommendation that would suit everyone. Instead, I’ll suggest you start with the three pillars of algorithmic trading I described above (statistics, programming and risk management) and refer you to Robot Wealth’s recommended reading list. What you should read also depends on the direction in which you want to go. For example, if you are interested in options trading, you’ll want to study volatility and pricing models, which I’ve barely mentioned in the blog so far. Likewise, if you are interested in high frequency trading, you’ll need a solid grounding in market microstructure and order book dynamics. Other directions include derivatives pricing and portfolio management and you could spend a lifetime learning about any one of these topics. Having said that, relationships exist between these topics and there is benefit in holistic understanding, so try not to limit yourself to one particular field.
Personally, when I was starting out I read voraciously anything to do with trading, and I know that even with such an appetite one can’t possibly get through all the texts in the reading list in great detail. But happily, you don’t need to. Far more important than details is understanding the practical application and where to find the detailed information when you need it. For example, take Tsay’s Analysis of Financial Time Series – this weighty tome is a classic econometric text that you could easily pore over for months, if not years. However, it is far more useful from a practical perspective to understand it to the point that you could, for example, describe the inputs to, and the uses and limitations of an ARMA or GARCH model. Knowing where to find more detailed information around the implementation and diagnostics when you actually need them is enough.
Finally, understand that when you read the work of others, whether that be in an academic paper, a blog post or a book, that the author is likely not giving away the keys to the successful implementation of any trading idea that may be described (Robot Wealth included…sorry folks). Often the way a strategy is tuned, optimized and applied is the key to making it work. Therefore, if you use the work of others, you absolutely must apply your own unique twist to it. Read everything with an evidence-based and critical mindset, and don’t believe anything until you prove it to yourself.
Infrastructure
We’ve discussed the technical and non-technical skills that are required for algorithmic trading, but have barely mentioned another key ingredient: infrastructure. Without good infrastructure and execution – that is, a system that can read market and other data, perform computations and send instructions to a broker or exchange – you can’t trade. It therefore pays to understand how a trading interface receives and sends information over a network. For this, you’ll need to know how to use Application Programming Interfaces (APIs), which is just a fancy way of describing how to communicate with a particular software application. Most brokers offer trading via an API, but the quality of the API documentation varies greatly. Poor quality API documentation can make developing trading infrastructure quite painful, so it pays to look into this when shopping for brokers.
While most brokers offer their own API for electronic trading, there is an industry standard protocol, namely FIX, or Financial Information Exchange. While broker APIs vary, the FIX protocol is an industry standard and can be used across a range of brokers and financial institutions. At its core, FIX is a simple messaging protocol, but in practice it can be tricky to get started with, particularly if you’re not a software developer (at least that’s what I found). A good place to start is QuickFIX, which is an open source implementation of the FIX protocol. It is a C++ library, but comes with bindings for a number of languages. Expect some pain getting to know QuickFIX (the documentation isn’t amazing), but I strongly believe it is worth your time. In the future, I’ll share some trading applications built on FIX in both Python and .Net frameworks.
The actual hardware required for an algorithmic trading business is less of an issue than it was in years gone by thanks to the rise of cloud computing and commercial hosting services. For example, it makes sense for many traders to outsource their hardware requirements to an external provider rather than maintaining dedicated trading machines with backup power and network connectivity in their own homes. The exceptions are low-latency systems, over which the trader will probably want to retain ultimate control.
Another piece of the puzzle is data: where to get it, how much to pay for it, and how to clean, process and manage it. These are all important questions. Remember that when you build trading models, they are only as good as the data that was used. Obtaining end-of-day data for some markets is relatively simple these days via sources like Yahoo! and Google. It is hard to find good, free, intra-day data and usually you will wind up paying for it or collecting it yourself or both. It is also worth remembering that the data relevant to financial markets extends far beyond price and trade history data. Data aggregation services like Quandl provide a large and growing repository of information that you may be able to use in a trading strategy, and you can also gather your own alternative data sets like social media sentiment, machine readable earnings announcements, economic data releases and the like. Creativity in this space is a good thing!
The Last Word
Seasoned algo traders will notice that so far I have barely touched on simulation, curve fitting and robust optimisation in this ‘Back to Basics’ series. I know this seems like a glaring omission, but these topics justify their own exclusive post. That’s the subject of the next and final post in this series.
This post was based on my own experiences of learning algorithmic trading initially as a hobby, then a passion, then a career. The post wound up being longer than I anticipated since it turns out that the topic of what to learn and how to learn it is actually quite a broad one. If you have read it all the way to end, thank you. I hope it was useful. I would love to hear about your own journey with algorithmic trading in the comments.
Master Your Setup, Master Your self. (NQoos)
2
- #1,777
- May 26, 2017 7:49am May 26, 2017 7:49am
- | Commercial User | Joined Apr 2013 | 4,366 Posts
DislikedBack to Basics Part 2 How to Succeed at Algorithmic Trading Posted on March 20, 2017 by Kris LongmoreIgnored
- #1,778
- May 27, 2017 5:13am May 27, 2017 5:13am
- Joined Apr 2011 | Status: Cut Your Losses, Ride Your Winners. | 2,914 Posts
Free Friday #16 Market Regime Switching Models
April 23, 2017
Happy Friday!
For this Free Friday edition I want to talk about market regimes or market filters. I have a very simple intermarket filter or regime monitor to share.
The idea with market regimes or filters is to identify a condition or set of conditions that alters the market's characteristics or risk profile. Ideally, you could find a bull and bear regime that would enable you to go long when in the bull regime and get into cash or go short when in the bear regime.
The simple regime filter I want to share was found using Build Alpha's intermarket signals. It only uses one rule and creates a clear bullish and bearish regime.
The rule says that if the Close of eMini S&P500 divided by the Close of the US 10 Yr Notes is less than or equal to the 10 day simple moving average of the eMini S&P500 divided by the 10 day simple moving average of the US 10 Yr Notes then we are in the bull regime.
Here it is in pseudo-code assuming eMini S&p500 is market 1 and US 10 Yr Note is market 2.
Bull = Close1/Close2 <= SMA(Market1,10) / SMA(Market2,10)
Bear=Close1/Close2 > SMA(Market1,10) / SMA(Market2,10)
Let's verify with some numbers that we have a discernible difference in market activity before I start flashing some charts at you.
Here are the S&P500's descriptive statistics when in the bull regime:
- Average Daily Return: 1.20
Std Dev Daily Return: 17.49
Annualized Information Rate:1.09
Here are the S&P500's descriptive statistics when in the bear regime:
- Average Daily Return: -0.34
Std Dev Daily Return: 12.11
Annualized Information Rate:-0.44
This would definitely qualify as something of interest. Let's take a look at the equity curve going long when ES, the eMini S&P500 futures, enter into the bull regime.
It actually performed quite well with no other rules or adjustments only trading 1 contract since early 2002. It even looks to have started to go parabolic in the out of sample data (last 30% highlighted).
Build Alpha now offers another check for validity -> The ability to test strategy rules across other markets. This is very important when determining how well a rule generalizes to new (and different) data. The user can select whatever markets to compare against, but in the example below I chose the other US equity index futures contracts. You can see Nasdaq futures in gold, Russell Futures in green, and Dow Jones futures in red.
Now back to our Free Friday regime filter... Wouldn't it be cool if the US 10 Yr Note performed well while eMini S&P500 was in the bear regime? That way instead of divesting from the S&P500 and going into cash we could invest in US 10 Yr Notes until our bull regime returned.
Well guess what... the US 10 Yr Note Futures do perform better in the bear regime we've identified.
The best part is... Build Alpha now let's you test market regime switching strategies.
That is, invest in one market when regime is good and invest in another market when regime changes. This ability smoothed our overall equity curve and increased the profit by about 50%! Below is an equity curve going long eMini S&P500 in the bull regime and going long US 10 Yr Note Futures when the regime turns bearish.
Some major new additions coming to Build Alpha and I'll be announcing them soon. As always thanks for taking the time to read these.
Happy Friday,
Dave
Attached Images
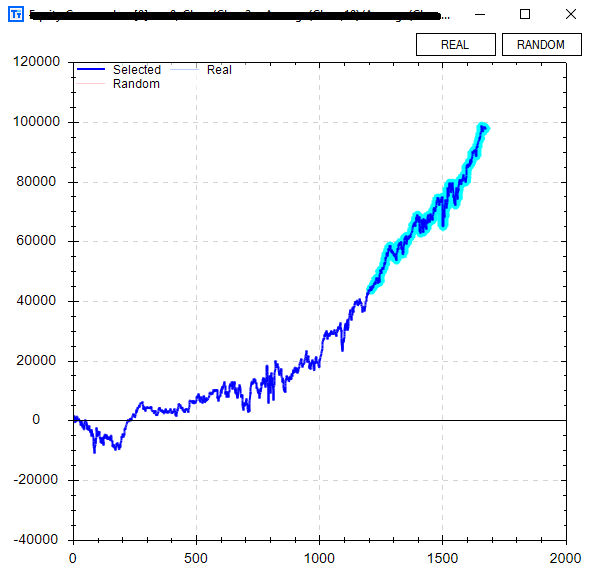
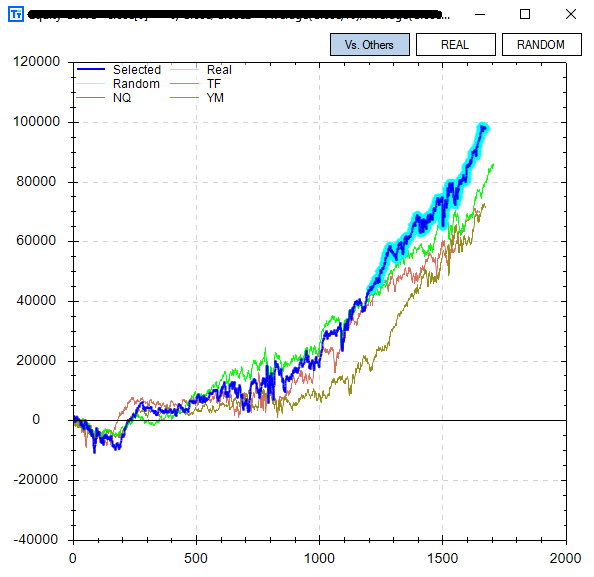
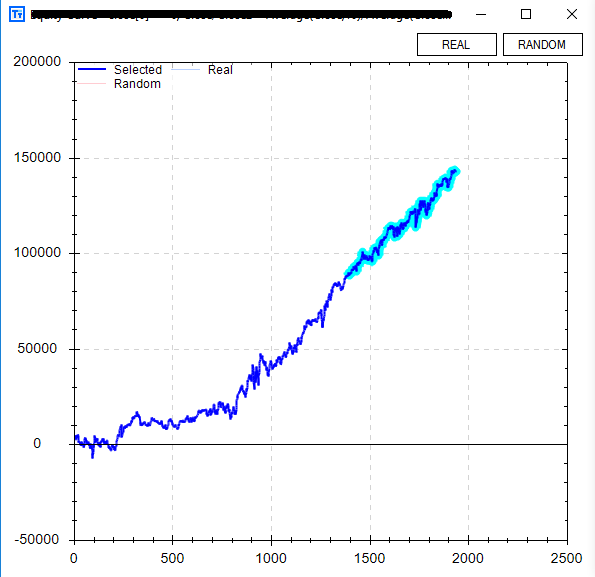
Master Your Setup, Master Your self. (NQoos)
1
- #1,779
- Edited May 31, 2017 8:42am May 30, 2017 9:54am | Edited May 31, 2017 8:42am
- Joined Apr 2011 | Status: Cut Your Losses, Ride Your Winners. | 2,914 Posts
Master Your Setup, Master Your self. (NQoos)
- #1,780
- Jun 30, 2017 8:40pm Jun 30, 2017 8:40pm
- | Commercial User | Joined Apr 2013 | 4,366 Posts
DislikedTrading strategy Guides Are u kidding me : Nanex's High Frequency Trading Model (Sped Up)Ignored